A guide to using Chrome DevTools for debugging WebAssembly code, including setting breakpoints and catching exceptions.
<p>When I was working on the <a class="reference external" href="https://eli.thegreenplace.net/2026/compiling-scheme-to-webassembly/">WASM backend for my Scheme compiler</a>,
I ran into several tricky situations with debugging generated WASM code. It
turned out that Chrome has a very capable WASM debugger in its DevTools, so in
this brief post I want to share how it can be used.</p>
<div class="section" id="the-setup-and-harness">
<h2>The setup and harness</h2>
<p>I'll be using an example from my <a class="reference external" href="https://github.com/eliben/wasm-wat-samples">wasm-wat-samples project</a> for this post. In fact,
everything is already in place in the <a class="reference external" href="https://github.com/eliben/wasm-wat-samples/tree/main/gc-print-scheme-pairs">gc-print-scheme-pairs</a>
sample. This sample shows how to construct Scheme-like s-exprs in WASM using gc
references and print them out recursively. The sample supports nested pairs
of integers, booleans and symbols.</p>
<p>To see this in action, we have to first compile the WAT file to WASM, for
example using <a class="reference external" href="https://github.com/eliben/watgo">watgo</a>:</p>
<div class="highlight"><pre><span></span>$ cd gc-print-scheme-pairs
$ watgo parse gc-print-scheme-pairs.wat -o gc-print-scheme-pairs.wasm
</pre></div>
<p>The <tt class="docutils literal"><span class="pre">browser-loader.html</span></tt> file in that directory already expects to load
<tt class="docutils literal"><span class="pre">gc-print-scheme-pairs.wasm</span></tt>. But we can't just open it
directly from the file-system; since it loads WASM, this file needs to be
served with a local HTTP server. I personally use <a class="reference external" href="https://github.com/eliben/static-server/">static-server</a>
for this, but you can use anything else - like Python's built-in <tt class="docutils literal">http.server</tt>:</p>
<div class="highlight"><pre><span></span>$ static-server
2026/04/10 08:55:20.244096 Serving directory "." on http://127.0.0.1:8080
...
</pre></div>
<p>Now it can be opened in the browser by following the printed link and selecting
the <tt class="docutils literal"><span class="pre">browser-loader.html</span></tt> file.</p>
</div>
<div class="section" id="the-debugging-process">
<h2>The debugging process</h2>
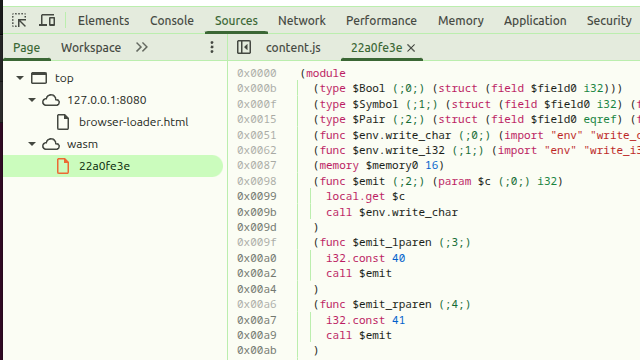
<p>Open the Chrome DevTools, and in <em>Sources</em>, open the <em>Page</em> view on the left.
It should have one entry under <em>wasm</em>, which will show the decompiled WAT
code for our module. Note: this code is disassembled from the binary WASM, so
it will lose some WAT syntactic sugar (like folded instructions):</p>
<img alt="Screenshot showing where WASM source is in DevTools" class="align-center" src="https://eli.thegreenplace.net/images/2026/wasm-debug-screenshot1.png" />
<p>You can set a breakpoint by clicking on the address column to the left of the
code, and then refresh the page. The DevTools debugger will run the program
again and stop at the breakpoint:</p>
<img alt="Screenshot showing debugger stopping on the breakpoint line" class="align-center" src="https://eli.thegreenplace.net/images/2026/wasm-debug-screenshot2.png" />
<p>Here you can step over, into, see local values and call stack, etc - a real
debugger!</p>
</div>
<div class="section" id="debugging-unexpected-exceptions">
<h2>Debugging unexpected exceptions</h2>
<p>The most important use case for me while developing the compiler was debugging
unexpected exceptions (coming from instructions like <tt class="docutils literal">ref.cast</tt>). Notice
the checkboxes saying "Pause on ... exceptions" on the right-hand side of the
previous screenshot. With these selected, the DevTools debugger will
automatically stop on an exception and show where it is coming from. Let's
modify the <tt class="docutils literal"><span class="pre">gc-print-scheme-pairs.wat</span></tt> sample to see this in action. The
<tt class="docutils literal">$emit_value</tt> function performs a set of <tt class="docutils literal">ref.test</tt> checks to see which kind
of reference it's dealing with before casting; let's add this line at the
very start:</p>
<div class="highlight"><pre><span></span>(call $emit_bool (ref.cast (ref $Bool) (local.get $v)))
</pre></div>
<p>It's clearly wrong to assume that <tt class="docutils literal">$v</tt> is a bool reference without first
testing it; this is just for demonstration purposes.</p>
<p>Without setting any breakpoints, recompiling this code with <tt class="docutils literal">watgo</tt> and
reloading the page, we get:</p>
<img alt="Screenshot showing debugger stopping on an exception" class="align-center" src="https://eli.thegreenplace.net/images/2026/wasm-debug-screenshot3.png" />
<p>The debugger stopped at the instruction causing the exception; moreover, in the
<em>Scope</em> pane on the right we can see that the actual type of <tt class="docutils literal">$v</tt> is
<tt class="docutils literal">(ref $Pair)</tt>, so it's immediately clear what's going on.</p>
<p>I've found this capability extremely valuable when writing (or emitting from
a compiler) non-trivial chunks of WASM code using gc types and instructions.</p>
</div>
<div class="section" id="debugger-vs-printfs-in-wasm">
<h2>Debugger vs. printfs in wasm</h2>
<p>"Should I use a debugger or just printfs" is a common topic of debate among
programmers. While I'm usually in the "printf debugging"
camp, I'm not dogmatic, and will certainly reach for a debugger when
the situation calls for it.</p>
<p>Specifically, when investigating reference exceptions in WASM, two strong
factors tilt the decision towards using a debugger:</p>
<ol class="arabic">
<li><p class="first">In general, WASM's printf capabilities aren't great. We can import print-like
functions from the host (and - in fact - our sample does just that), but
they're not very flexible and dealing with strings in WASM is painful in
general. This is compounded even more when working with gc types, because
these aren't even visible to the host (they're opaque references). If we want
to do printf debugging of gc values, we have to build <em>a lot</em> of scaffolding
first.</p>
</li>
<li><p class="first">Exception debugging - in general - is much easier with a supportive debugger
in hand. Our <tt class="docutils literal">ref.cast</tt> exception from the example above could have
happened <em>anywhere</em> in the code. Imagine having to debug a very large
WASM program (emitted by a compiler) to find the source of a failed
<tt class="docutils literal">ref.cast</tt>; the debugger takes you right to the spot!</p>
<p>In fact, even for C programming, I've always found <tt class="docutils literal">gdb</tt> most useful for
pinpointing the source of segmentation faults and similar crashes.</p>
</li>
</ol>
</div>
# Debugging WASM in Chrome DevTools
Source: [https://eli.thegreenplace.net/2026/debugging-wasm-in-chrome-devtools](https://eli.thegreenplace.net/2026/debugging-wasm-in-chrome-devtools)
When I was working on the[WASM backend for my Scheme compiler](https://eli.thegreenplace.net/2026/compiling-scheme-to-webassembly/), I ran into several tricky situations with debugging generated WASM code\. It turned out that Chrome has a very capable WASM debugger in its DevTools, so in this brief post I want to share how it can be used\.
## The setup and harness
I'll be using an example from my[wasm\-wat\-samples project](https://github.com/eliben/wasm-wat-samples)for this post\. In fact, everything is already in place in the[gc\-print\-scheme\-pairs](https://github.com/eliben/wasm-wat-samples/tree/main/gc-print-scheme-pairs)sample\. This sample shows how to construct Scheme\-like s\-exprs in WASM using gc references and print them out recursively\. The sample supports nested pairs of integers, booleans and symbols\.
To see this in action, we have to first compile the WAT file to WASM, for example using[watgo](https://github.com/eliben/watgo):
```
$ cd gc-print-scheme-pairs
$ watgo parse gc-print-scheme-pairs.wat -o gc-print-scheme-pairs.wasm
```
Thebrowser\-loader\.htmlfile in that directory already expects to loadgc\-print\-scheme\-pairs\.wasm\. But we can't just open it directly from the file\-system; since it loads WASM, this file needs to be served with a local HTTP server\. I personally use[static\-server](https://github.com/eliben/static-server/)for this, but you can use anything else \- like Python's built\-inhttp\.server:
```
$ static-server
2026/04/10 08:55:20.244096 Serving directory "." on http://127.0.0.1:8080
...
```
Now it can be opened in the browser by following the printed link and selecting thebrowser\-loader\.htmlfile\.
## The debugging process
Open the Chrome DevTools, and in*Sources*, open the*Page*view on the left\. It should have one entry under*wasm*, which will show the decompiled WAT code for our module\. Note: this code is disassembled from the binary WASM, so it will lose some WAT syntactic sugar \(like folded instructions\):
You can set a breakpoint by clicking on the address column to the left of the code, and then refresh the page\. The DevTools debugger will run the program again and stop at the breakpoint:
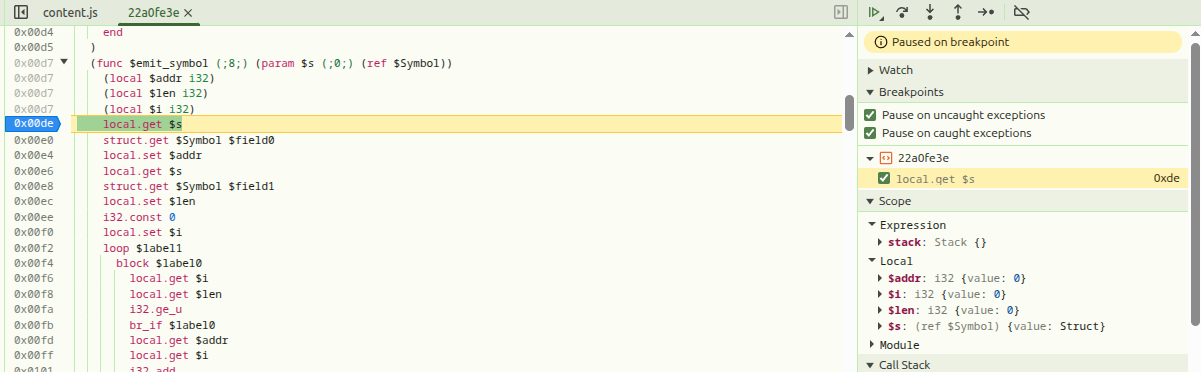
Here you can step over, into, see local values and call stack, etc \- a real debugger\!
## Debugging unexpected exceptions
The most important use case for me while developing the compiler was debugging unexpected exceptions \(coming from instructions likeref\.cast\)\. Notice the checkboxes saying "Pause on \.\.\. exceptions" on the right\-hand side of the previous screenshot\. With these selected, the DevTools debugger will automatically stop on an exception and show where it is coming from\. Let's modify thegc\-print\-scheme\-pairs\.watsample to see this in action\. The$emit\_valuefunction performs a set ofref\.testchecks to see which kind of reference it's dealing with before casting; let's add this line at the very start:
```
(call $emit_bool (ref.cast (ref $Bool) (local.get $v)))
```
It's clearly wrong to assume that$vis a bool reference without first testing it; this is just for demonstration purposes\.
Without setting any breakpoints, recompiling this code withwatgoand reloading the page, we get:
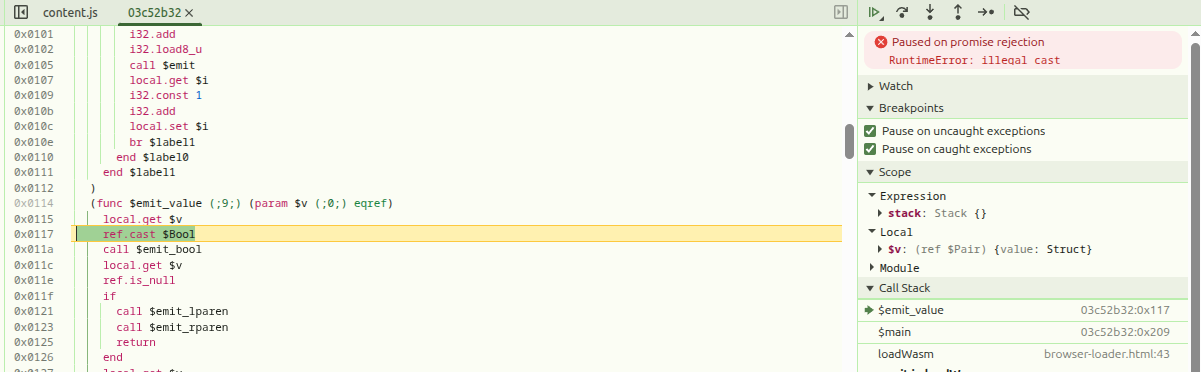
The debugger stopped at the instruction causing the exception; moreover, in the*Scope*pane on the right we can see that the actual type of$vis\(ref $Pair\), so it's immediately clear what's going on\.
I've found this capability extremely valuable when writing \(or emitting from a compiler\) non\-trivial chunks of WASM code using gc types and instructions\.
## Debugger vs\. printfs in wasm
"Should I use a debugger or just printfs" is a common topic of debate among programmers\. While I'm usually in the "printf debugging" camp, I'm not dogmatic, and will certainly reach for a debugger when the situation calls for it\.
Specifically, when investigating reference exceptions in WASM, two strong factors tilt the decision towards using a debugger:
1. In general, WASM's printf capabilities aren't great\. We can import print\-like functions from the host \(and \- in fact \- our sample does just that\), but they're not very flexible and dealing with strings in WASM is painful in general\. This is compounded even more when working with gc types, because these aren't even visible to the host \(they're opaque references\)\. If we want to do printf debugging of gc values, we have to build*a lot*of scaffolding first\.
2. Exception debugging \- in general \- is much easier with a supportive debugger in hand\. Ourref\.castexception from the example above could have happened*anywhere*in the code\. Imagine having to debug a very large WASM program \(emitted by a compiler\) to find the source of a failedref\.cast; the debugger takes you right to the spot\! In fact, even for C programming, I've always foundgdbmost useful for pinpointing the source of segmentation faults and similar crashes\.
A developer shares their experience porting a C game to WebAssembly, detailing bugs encountered due to 32-bit vs 64-bit differences and offering debugging tips.
Weblings is a Rust compiler toolchain compiled to WebAssembly, enabling compilation and execution of Rust code directly in the browser via a web UI with a playground and Rustlings exercises.
Wasmtime 47 enables Wasm GC and exceptions proposals by default, making it easier for high-level languages with garbage collection and exceptions to target WebAssembly efficiently.
Codex's Browser Use feature adds Chrome DevTools Protocol support, enabling developers to deeply debug web applications by inspecting network traffic, performance analysis, console logs, and other advanced features.