@Greptime: trace_id is high-cardinality — so Xiaomi's smart factory team didn't reach for an inverted index. They put a Bloom skip…
Summary
Xiaomi's smart factory replaced Loki with GreptimeDB for log storage, handling billions of rows per month with tailored indexing: Bloom skipping for high-cardinality trace_id, inverted index for low-cardinality fields, and fulltext search on message bodies.
View Cached Full Text
Cached at: 06/24/26, 07:59 AM
trace_id is high-cardinality — so Xiaomi’s smart factory team didn’t reach for an inverted index.
They put a Bloom skipping index on it. Inverted index goes on the low-cardinality fields (log_level, service); fulltext on the message body. Right index for the shape of each field.
Billions of log rows/month, sub-second TraceID lookups on GreptimeDB — Promtail left untouched.
See another case study replacing Loki with GreptimeDB:
https://greptime.com/blogs/2026-06-22-xiaomi-factory-log-case…
How Xiaomi’s smart factory stores system interaction logs on GreptimeDB
Source: https://greptime.com/blogs/2026-06-22-xiaomi-factory-log-case Xiaomi’s smart factory stores its system interaction logs on GreptimeDB, handling billions of rows a month with fast, indexed retrieval. As log volumes grew, the team moved to it from a Loki-based pipeline, keeping Promtail on the collection side. Here’s how they built it, and what they learned along the way.
Background
In the digital operations of Xiaomi’s smart factory, the log monitoring system is critical. It collects interaction logs between equipment and business systems in real time, helping engineers locate problems quickly and trace call paths.
The logs stored in GreptimeDB are system interaction logs, used for service-call troubleshooting, trace analysis, and runtime diagnostics.
As deployments expanded, some factories raised compliance requirements such as on-premises deployment: they wanted system interaction logs collected, stored, and queried entirely within the factory’s own private cluster. For a core service, a single month of system interaction logs can reach billions of rows, which sets a high bar for any storage and retrieval solution:
- Large time-range queries: Retrieving logs over hour- or day-level windows has to stay stable and never time out.
- Full-text keyword search: Engineers need to find entries quickly by keyword across a huge volume of log bodies.
- TraceID-based tracing: Following call paths across services by TraceID, with near-instant results.
The engineering team needed a solution that could handle billion-row log storage, provide efficient indexed retrieval, and stay compatible with mature, industry-standard collection pipelines.
Solution overview
After evaluation and validation, Xiaomi’s system interaction log solution uses Promtail for collection and GreptimeDB as the storage and query foundation. Public benchmarks on log workloads pointed the same way: GreptimeDB showed roughly 1.5× the ingestion throughput, 40–80× faster queries, and about 50% less storage than Loki (see ourGreptimeDB vs. Loki log performance report). The main reasons:
Native Promtail support
GreptimeDB exposes a Loki Push API, so Promtail pushes logs directly to GreptimeDB without swapping out the collection agent. Existing Promtail configurations and log-format definitions carry over as-is.
Rich indexing options
GreptimeDB offers several index types, so you can pick the right strategy for each field based on its query pattern:
Index TypeBest ForExample FieldsSkipping IndexHigh-cardinality equality lookupstrace\_id,span\_idInverted IndexLow-cardinality filteringlog\_level,serviceFulltext IndexKeyword search over log bodiesmessage### SQL query support
GreptimeDB supports standard SQL, so engineers run complex log analysis with the syntax they already know.
Automatic schema evolution
Log fields change often. GreptimeDB infers the types of new fields automatically and extends the table schema, so there’s no schema to maintain by hand.
Architecture
The overall architecture for system interaction logs looks like this:
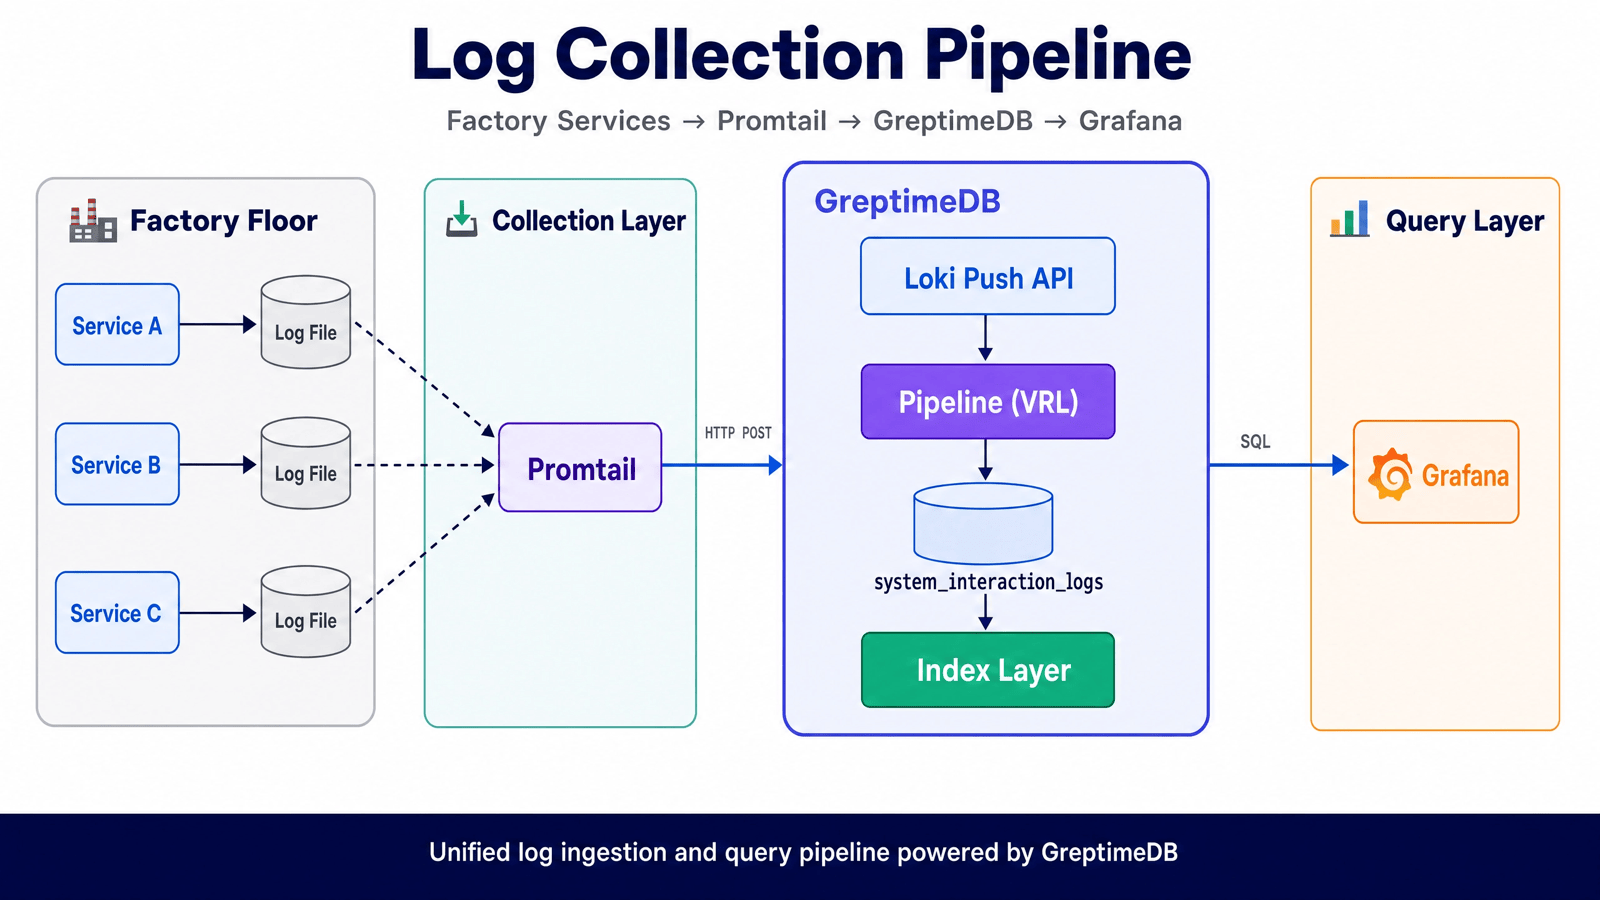
Each stage has a clear job:
- Promtail collection: Runs on each node to collect log files and push them over HTTP.
- Pipeline parsing: A VRL script parses JSON logs into structured fields.
- Multi-level indexing: Each field gets the index that fits its query pattern.
- SQL queries: Grafana queries logs via SQL through the GreptimeDB plugin.
GreptimeDB stores the parsed system interaction log fields, which serve runtime diagnostics, call-path troubleshooting, and log retrieval.
Deployment walkthrough
Step 1: Configure the log push endpoint
Promtail pushes logs through the Loki Push API that GreptimeDB provides:
yaml
clients:
  - url: http://<greptimedb-host>:4000/v1/loki/api/v1/push
    headers:
      Authorization: "Basic <base64_encoded_credentials>"
      x-greptime-db-name: "public"
      x-greptime-log-table-name: "system_interaction_logs"
One note on authentication: GreptimeDB uses HTTP Basic Auth, so Base64-encodeusername:passwordand put it in theAuthorizationheader.
Tip: If you hit authentication errors, check the Basic Auth configuration first. It’s the most common deployment issue.
Step 2: Configure a pipeline to parse JSON logs
System interaction logs are in JSON format, with many structured fields. To pull those fields into their own columns, configure a GreptimeDB Pipeline.
Since v0.15, GreptimeDB supports a VRL (Vector Remap Language) processor. Here’s an example configuration:
yaml
version: 2
processors:
  - vrl:
      source: |
        msg = parse_json!(.loki_line)
        . = {
          "log_time": parse_timestamp!(msg.timestamp, "%Y-%m-%d %T%.3f"),
          "log_level": msg.level,
          "logger": msg.logger,
          "message": msg.message,
          "exception": msg.exception,
          "service": .loki_label_job,
          "server_ip": msg.server_address,
          "client_ip": msg.client_ip,
          "thread": msg.thread,
          "duration_ms": to_float!(msg.time_spent),
          "trace_id": msg.trace_id,
          "span_id": msg.span_id,
        }
transform:
  - field: log_time
    type: time, ms
    index: timestamp
A few things worth calling out:
- Use
\.loki\_line: When you ingest through the Loki Push API, the log body maps to theloki\_linefield in GreptimeDB. - Use
\.loki\_label\_\*: Promtail labels are accessed in GreptimeDB with theloki\_label\_prefix. - Timestamp handling:
parse\_timestamp\!parses the timestamp from the log and uses it as the Time Index.
After you create the Pipeline, reference it in the Promtail configuration:
yaml
headers:
  x-greptime-pipeline-name: "system-interaction-log-json-parse"
Step 3: Add indexes to speed up queries
Based on real query patterns, configure the right index for each key field. Xiaomi’s team set up a Bloom-type skipping index ontrace\_id:
sql
ALTER TABLE system_interaction_logs
MODIFY COLUMN trace_id
SET SKIPPING INDEX WITH(
  granularity = 4096,
  type = 'BLOOM',
  false_positive_rate = 0.01
);
Index tuning tips: - A smaller
granularitymeans faster queries but a larger index. - If query performance still isn’t where you want it, try lowering granularity to 2048 or 1024. - Index changes apply only to newly written data; indexes for existing data aren’t rebuilt.
To enable full-text search on the log body:
sql
ALTER TABLE system_interaction_logs
MODIFY COLUMN message SET FULLTEXT INDEX;
Step 4: Configure the Grafana data source
Query logs using the GreptimeDB Grafana plugin:
- Install theGreptimeDB Grafana data source plugin
- Configure the data source connection
- Query logs with SQL in your dashboards
sql
SELECT greptime_timestamp, message, trace_id, log_level
FROM system_interaction_logs
WHERE greptime_timestamp >= $__fromTime
  AND greptime_timestamp <= $__toTime
  AND log_level = 'ERROR'
ORDER BY greptime_timestamp DESC
LIMIT 1000
Step 5: Set a data lifecycle
Production logs usually only need to be kept for a fixed period to meet compliance requirements. Use TTL to clean up expired data automatically. Set the retention period based on your own compliance requirements; the value below is just an example:
sql
ALTER TABLE system_interaction_logs SET 'ttl' = '30d';
Deletion runs asynchronously during compaction, so it never blocks writes or queries. Even a TTL on a very large table won’t freeze the system.
Lessons learned
Duplicate logs
Early in the deployment, logs showed up in duplicate, with every line followed by an identical copy. The cause turned out to be on the Promtail side: Logback and Promtail were both collecting the same log file, which produced duplicate writes.
Tip: If you see duplicate logs, check the collection pipeline configuration first, not GreptimeDB.
Choosing a version
Use a stable release in production. During deployment, the team first ran v0.17 and hit abnormal process CPU usage, where the flame graph showed nothing but kernel timer interrupts. Rolling back to v0.16 fixed it.
Tip: Watch GreptimeDB’s release notes, and validate any new version thoroughly in a test environment before you roll it out. GreptimeDB has since released v1.0, which improves stability further.
Monitor GreptimeDB itself
GreptimeDB exposes a/metricsendpoint, so you can scrape its own runtime metrics with Prometheus and catch memory or CPU anomalies early. OfficialGrafana dashboard templatesare available.
While running v0.16, the team hit an OOM that restarted the process once. Monitoring metrics surfaced it in time to handle it.
A note on TTL syntax
When you set TTL, the option name has to be quoted:
sql
-- Correct
ALTER TABLE system_interaction_logs SET 'ttl' = '30d';

-- Incorrect (throws an error)
ALTER TABLE system_interaction_logs SET TTL = '30d';
Results
So far, Xiaomi’s smart factory has completed a phased rollout of the system interaction log solution in one workshop, and it has performed as expected.
Query performance
- TraceID queries: Sub-second response, which meets the near-instant target.
- Time ranges: Stable log retrieval over hour-level time windows.
- Full-text search: Efficient keyword-based log search.
Storage efficiency
GreptimeDB’s columnar storage and compression give good storage efficiency at the billion-row scale, and TTL purges expired data automatically with no manual maintenance.
Operational experience
- Works with the existing collection pipeline: Minimal changes to the Promtail configuration.
- Automatic schema evolution: No manual table changes when new log fields show up.
- Standard SQL: Lowers the learning curve for queries.
Conclusion
The key steps to building a system interaction log solution on GreptimeDB:
- Configure the log push endpoint: Promtail writes to GreptimeDB through the Loki Push API with Basic Auth.
- Design the pipeline: Write VRL field-extraction rules to match your log format.
- Optimize indexes: Add skipping indexes on high-cardinality fields based on query patterns, and lower granularity when you need more speed.
- Query with SQL: Use the GreptimeDB Grafana plugin to retrieve logs with SQL.
For further reading:
If you’re weighing a similar move off Loki, OceanBase Cloud took the same path at a much larger scale:Scaling to 300TB: OceanBase Cloud’s Journey from Loki to GreptimeDB Enterprise— 300 TB of logs across 80+ clusters, with log storage cost down by more than 60%.
Thanks to the R&D team at Xiaomi’s smart factory for their feedback and collaboration throughout the deployment, which helped us keep improving GreptimeDB’s log-processing capabilities.
Similar Articles
@Greptime: GreptimeDB's flat-format queries can now prefilter on any column — tags, fields, timestamps — not just primary keys. Wh…
GreptimeDB's flat-format queries now support prefiltering on any column (tags, fields, timestamps), not just primary keys, delivering up to 4.5x faster performance. Additionally, the mito2 storage engine removed its legacy scan path, cleaning up about 1,800 lines of code.
@Greptime: We refreshed our deep-dive on Mito2, the storage engine inside GreptimeDB. LSM-tree write path. Columnar Parquet SSTs. …
GreptimeDB's Mito2 storage engine uses an LSM-tree design with columnar Parquet SSTs, three-level scan pruning, and TWCS compaction. The blog post provides a full walkthrough of its architecture.
@Greptime: Most of GreptimeDB's June work came down to one idea: a filter is no use if it can't reach the data. In a distributed q…
GreptimeDB improved distributed query performance by enabling remote dynamic filters to push down to datanode scans at runtime and optimizing the optimizer to run before MergeScan wraps remote plans, ensuring filters reach the data. JSON v2 columns now support type hints.
@Greptime: DataFusion shipped dynamic filter pushdown upstream last September. GreptimeDB v1.0 wires it into the Mito scan layer. …
GreptimeDB v1.0 integrates DataFusion's dynamic filter pushdown to accelerate TopK queries by pushing runtime bounds to the scan layer, reducing query time from 29 seconds to 0.21 seconds on a 5B-row trace table.
@LangChain: How do you support full-text search JSON filtering over agent traces that span up to hundreds of MBs, while keeping a m…
LangChain engineers detail how they built a custom inverted index for SmithDB to support full-text search and JSON filtering over large agent traces stored in object storage, achieving median latency of 400ms despite huge payload sizes.