Cached at:
09/26/26, 01:25 PM
# Tuning a Server for Benchmarking
Source: [https://david.alvarezrosa.com/posts/tuning-a-server-for-benchmarking/](https://david.alvarezrosa.com/posts/tuning-a-server-for-benchmarking/)
Optimizing code starts with measuring it, and a measurement is only useful if it is repeatable: a 2% improvement is invisible under 5% of noise\. Yet on an untuned machine the same binary can easily run several percent faster or slower between runs\. In this post we take a tiny benchmark and tune the machine step by step, re\-measuring after every change, until runs become deterministic\.11Note that tuning for*benchmarking*is not the same as tuning for*performance:*a benchmark wants the machine repeatable, even at the cost of some peak speed\. A production box, however, wants every last bit of speed\.
## A noisy baseline[§](https://david.alvarezrosa.com/posts/tuning-a-server-for-benchmarking/#a-noisy-baseline)
Our running example sums an array of doubles, in short bursts\. Real services rarely hammer the CPU continuously: they handle a request, sit idle, and wake up for the next one\. Each timed iteration here runs a burst of 256 sums after a 2 ms idle gap, with the gap excluded from the measurement22`PauseTiming`/`ResumeTiming`keep the sleep out of the measured time, and`DoNotOptimize`keeps the result alive past the optimizer; without it the compiler deletes the entire loop\.
```
static auto BM_Sum(benchmark::State& state) -> void {
alignas(64) static std::array<double, 4096> data;
std::iota(data.begin(), data.end(), 0.0);
for (auto _ : state) {
state.PauseTiming(); // Idle between bursts, like a real service
std::this_thread::sleep_for(std::chrono::milliseconds(2));
state.ResumeTiming();
for (auto i = 0; i < 256; ++i) {
auto sum = std::accumulate(data.cbegin(), data.cend(), 0.0);
benchmark::DoNotOptimize(sum);
}
}
}
BENCHMARK(BM_Sum);
```
Compile it in release with all optimizations,`\-O3`, and`\-march=native \-mtune=native \-flto \-ffast\-math`\. Then run ten repetitions and aggregate them
```
$ ./benchmark --benchmark_repetitions=10 --benchmark_min_time=100x
BM_Sum_mean 99575 ns
BM_Sum_stddev 2704 ns
BM_Sum_cv 2.72 %
```
The interesting line is`cv`, the coefficient of variation: standard deviation divided by mean\. Almost**3%**of run\-to\-run noise—any optimization smaller than that is invisible\. Let’s bring it down\.
## Know your hardware[§](https://david.alvarezrosa.com/posts/tuning-a-server-for-benchmarking/#know-your-hardware)
Before turning any knob, look at what you are tuning\.`lstopo`draws the whole machine in one picture: caches, cores, SMT pairs, and the PCIe devices hanging off them\. Start with my laptop
Figure 1:**My laptop \(Intel Core Ultra 5 135U\)\.**Three kinds of cores: two P\-cores with two hardware threads each \(dotted\), eight E\-cores in clusters of four sharing an L2, and two low\-power E\-cores \(bottom left\) sitting outside the L3 entirely\.
[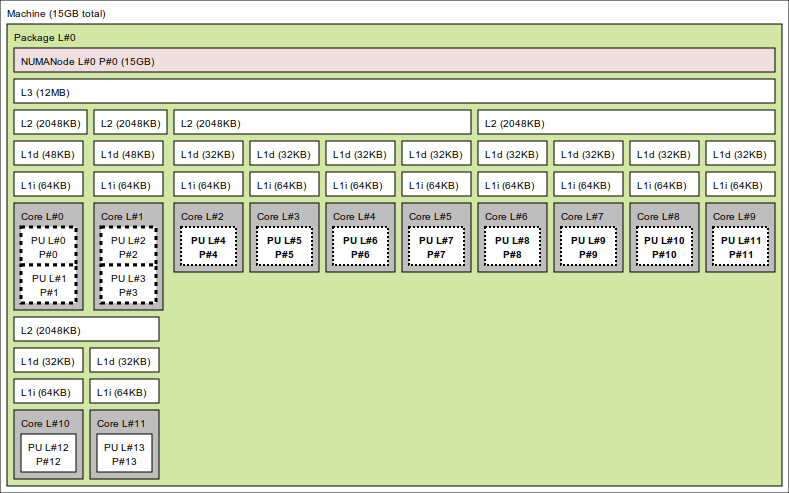](https://david.alvarezrosa.com/images/lstopo-laptop.png)Here the choice of core changes what you measure: land on CPU 4 and you get an E\-core at lower clocks; on CPU 12 you lose the L3 too\. Now compare that against my homelab server
Figure 2:**My homelab server \(AMD Ryzen 7 PRO 8700GE\)\.**Eight identical cores with identical caches; the NVMe drives and the NIC hang off PCIe on the right\.
[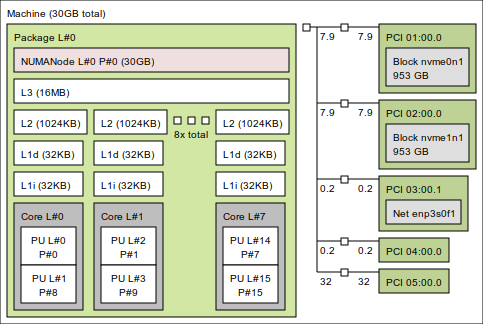](https://david.alvarezrosa.com/images/lstopo-homelab.png)On the server every core is as good as any other: homogeneous machines make better benchmarking boxes\. The PCIe side matters once a benchmark touches I/O: it shows which NVMe or NIC you are exercising and, on multi\-socket machines, which NUMA node it hangs off\.
## Pin to a core[§](https://david.alvarezrosa.com/posts/tuning-a-server-for-benchmarking/#pin-to-a-core)
The scheduler is free to migrate the benchmark between cores, and every migration throws away warm caches\. On hybrid CPUs it’s worse: performance and efficiency cores run the same code at very different speeds, so results turn bimodal depending on where the process lands\. Pin the benchmark to a single core \(on hybrid parts, a P\-core\)
```
$ taskset -c 2 ./benchmark ...
```
The mean falls to**55\.3 µs**and the CV better than halves, to**1\.06%**\. The win is bigger than migration costs alone would suggest: every burst now wakes the same core, so that core’s clock never has time to sag between bursts\.33Pinning puts the benchmark*onto*the core but does not keep*other*tasks off it\. On a busy box, go further and reserve the core for the benchmark alone, either on the kernel command line \(`isolcpus=2 nohz\_full=2 rcu\_nocbs=2`\) or at runtime with a`cpuset`cgroup\.
## Lock the CPU frequency[§](https://david.alvarezrosa.com/posts/tuning-a-server-for-benchmarking/#lock-the-cpu-frequency)
By default Linux scales the CPU frequency with load, so the benchmark starts on a cold, slow clock and finishes on a hot, fast one\. Switch the frequency governor to`performance`to keep clocks locked high
```
$ sudo cpupower frequency-set --governor performance
```
and verify it took effect
```
$ cat /sys/devices/system/cpu/cpu0/cpufreq/scaling_governor
performance
```
Re\-measuring gives a mean of**54\.9 µs**and a CV of**0\.79%**\. The increment looks modest only because pinning already kept our core’s clock warm: on its own, the performance governor takes the unpinned baseline from 99\.6 µs straight to 54\.5 µs\. Either way, no burst ever wakes up on a cold clock again\.
## Disable hyperthreading[§](https://david.alvarezrosa.com/posts/tuning-a-server-for-benchmarking/#disable-hyperthreading)
CPU still shares its execution units and L1/L2 caches with its SMT sibling: anything the scheduler places there perturbs our measurement\. Disable SMT entirely
```
$ echo off | sudo tee /sys/devices/system/cpu/smt/control
```
The CV drops to**0\.26%**, three times better: the core now has its execution units and caches all to itself\.
## Disable turbo boost[§](https://david.alvarezrosa.com/posts/tuning-a-server-for-benchmarking/#disable-turbo-boost)
Even with the performance governor, turbo frequencies vary with temperature and power budget: the same run on a warm machine clocks lower than on a cool one\. Disable turbo for stable clocks
```
$ echo 0 | sudo tee /sys/devices/system/cpu/cpufreq/boost
```
On this machine nothing changes, since our short bursts never gave the silicon time to boost anyway\. On a machine where turbo does engage, expect the mean to climb instead: you are giving up peak performance\. That trade is fine, since when optimizing we care about*relative*numbers, and those are now comparable across runs\.44Low\-latency production tuning makes the*opposite*call and keeps turbo on: there, every nanosecond counts\. The most latency\-sensitive trading shops go further and run overclocked servers, locked at a fixed all\-core frequency above stock—speed*and*stable clocks, bought with better cooling\.
## Summary[§](https://david.alvarezrosa.com/posts/tuning-a-server-for-benchmarking/#summary)
Here is the whole journey in one table, each row adding one change on top of all the previous ones\. We went from almost**3%**of noise down to**0\.26%**, and got 1\.8x faster along the way; differences of half a percent are now real, measurable signal\.55Feel free to reproduce on your machine using the[benchmark](https://github.com/david-alvarez-rosa/CppPlayground/blob/main/scratch/benchmark.cpp)from my[CppPlayground](https://github.com/david-alvarez-rosa/CppPlayground)repository\.
StepMeanStdDevCVUntuned99\.6 µs2\.70 µs2\.72%\+ pinned to one core55\.3 µs0\.59 µs1\.06%\+ performance governor**54\.9 µs**0\.43 µs0\.79%\+ hyperthreading off55\.3 µs0\.15 µs**0\.26%**\+ turbo disabled55\.5 µs0\.14 µs**0\.26%**On busier machines there is a longer tail of knobs worth trying: disabling address space layout randomization, the NMI watchdog, or transparent huge pages\. The[bench\-remote\.sh](https://github.com/david-alvarez-rosa/CppPlayground/blob/main/scripts/bench-remote.sh)script applies all\. None of it survives a reboot, which is exactly what you want: tune, measure, and reboot back to a normal machine\.
Long live reproducible benchmarks\!