Cached at:
05/09/26, 06:33 AM
# Boosting multimodal inference performance by >10% with a single Python dictionary | Modal Blog
Source: [https://modal.com/blog/boosting-multimodal-inference-performance-by-greater-than-10-with-a-single-python-dictionary](https://modal.com/blog/boosting-multimodal-inference-performance-by-greater-than-10-with-a-single-python-dictionary)
[Back](https://modal.com/blog)Engineering
May 4, 2026•5 minute read
> tl;dr: Multimodal models are promising, but inference engines haven't been optimized for them yet\. We profiled SGLang’s scheduler on a multimodal workload and identified an opportunity to replace expensive book\-keeping around shared GPU memory with a simple cache lookup\. Throughput and latency both improved over 10% on our target workload\. The improvement is merged in SGLang v0\.5\.10\.
MetricHandle Cache OFFHandle Cache ONImprovementThroughput \(req/s\)22\.225\.7\+16\.2%TTFT mean \(ms\)965838\-13\.2%TPOT mean \(ms\)7260\-17\.2%Multimodal vision\-language models \(VLMs\) give artificial intelligence eyes\. Our users deploy smaller VLMs for[efficient parsing of unstructured documents](https://modal.com/blog/reducto-case-study)and large ones to power[multimodal coding agents](https://qwen.ai/blog?id=qwen3.5)who can see the apps they are designing\.
These new input types and new models pose new challenges for open source inference engines, like[SGLang](https://github.com/sgl-project/sglang)and[vLLM](https://vllm.ai/)\. And one of the most stubborn challenges is maximizing performance \-\- solved here, as always, only by a relentless grind, one small improvement at a time\.
This blog post tells the story of[one](https://github.com/sgl-project/sglang/pull/21418)of those humble changes\.
While working with a customer, we were benchmarking[Qwen2\.5\-VL\-3B\-Instruct](https://huggingface.co/Qwen/Qwen2.5-VL-3B-Instruct)on H100s, and we noticed that SGLang’s throughput had plateaued well below what the GPU could handle\. The solution was to remember the "golden rule" of inference performance engineering:[never block the GPU\.](https://modal.com/blog/host-overhead-inference-efficiency)
## Identifying host overhead
When you notice an inference performance issue, stop yourself from going[CUDA MODE](https://x.com/jeremyphoward/status/1735762761869635825?s=20)and scrutinizing warp stall reasons in Nsight Compute \-\- you can even put down the[Torch Profiler](https://modal.com/docs/examples/torch_profiling)\! Check the easy things first: what is happening on the host and why isn't it faster?
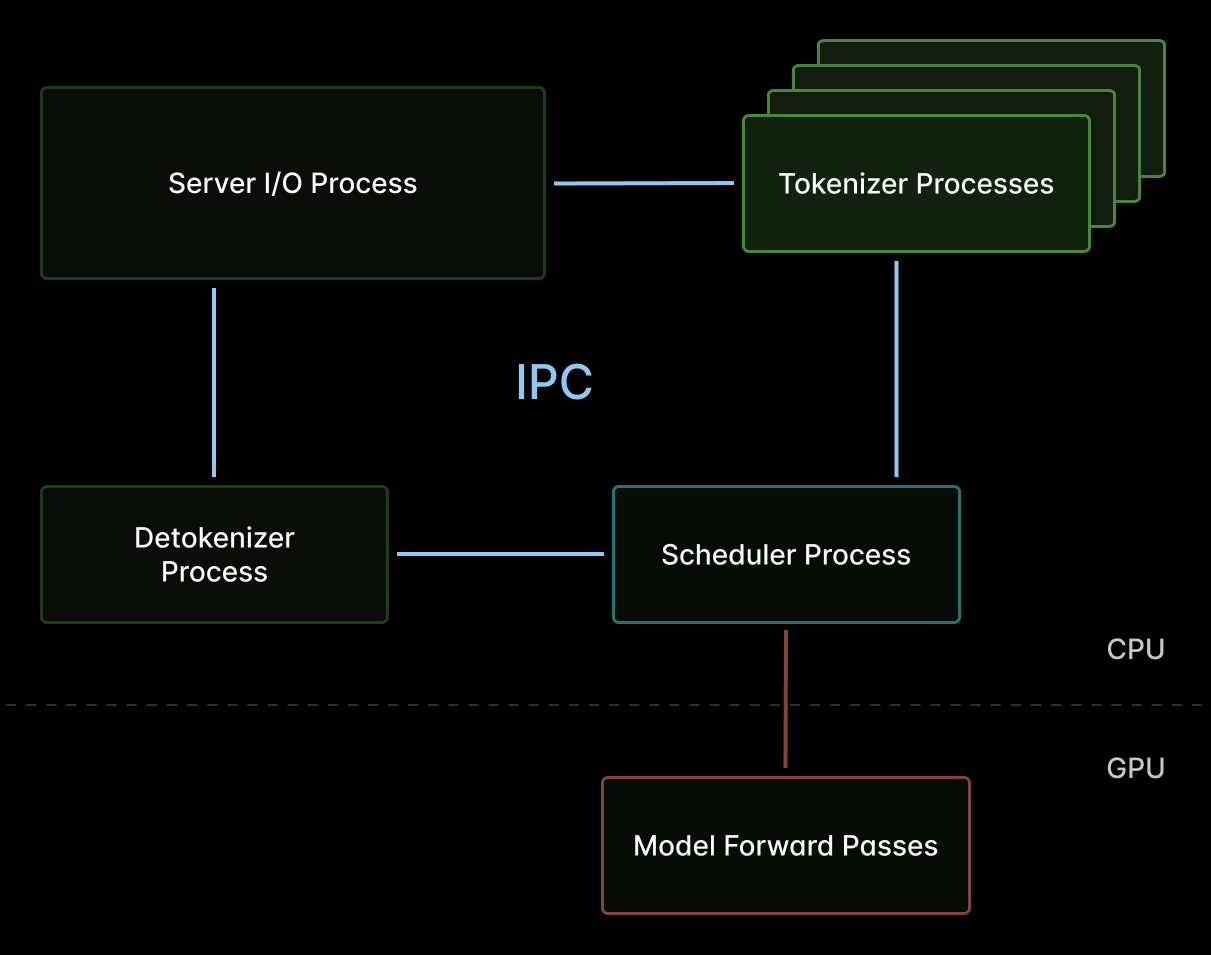
In \(V\)LM inference engines like SGLang, the*scheduler*is the key host\-side component and potential bottleneck \-\- a single\-threaded loop that gates submission of work the GPU\.
Every millisecond spent in the scheduler is a millisecond that prefill and decode iterations are stalled for*all in\-flight requests*\. We’ve[said it before](https://modal.com/blog/host-overhead-inference-efficiency): host overhead will kill your inference efficiency\.
## Introspecting overhead with py\-spy
So we attached the humble Python profiling tool[`py\-spy`](https://github.com/benfred/py-spy)to a running SGLang scheduler process serving multimodal traffic:
We love`py\-spy`\-\- it can sample call stacks from running Python programs with minimal overhead\. After 30 seconds of sustained multimodal traffic, we had ~3k samples and a usable[flamegraph](https://www.brendangregg.com/flamegraphs.html)\.
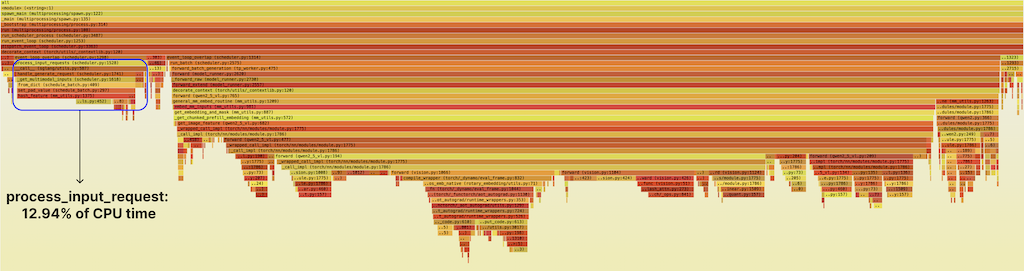
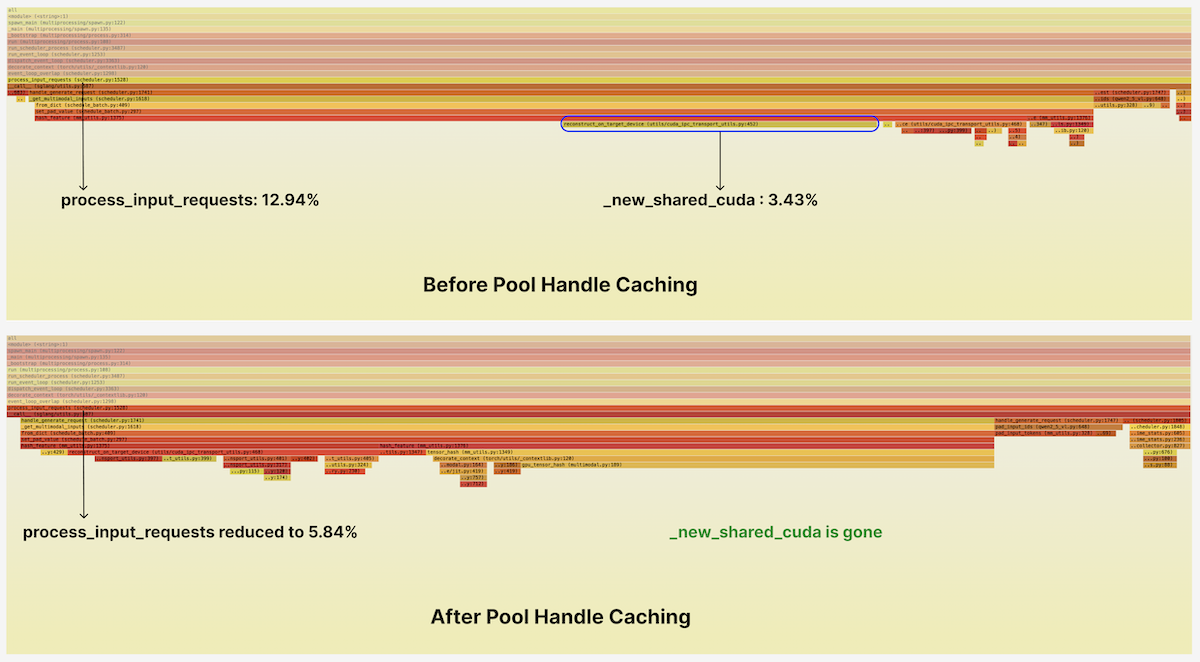
The highlighted band on the left is a function called[`process\_input\_requests`](https://github.com/sgl-project/sglang/blob/83997080a60fb7b2633c764701c4a2ab98389c89/python/sglang/srt/managers/scheduler.py#L1545)\. It prepares incoming multimodal requests so that the scheduler can form a batch and dispatch it to the GPU\. It consumed ~13% of total scheduler CPU time and stood out as a suspicious "mesa" in the flamegraph\.
Drilling into`process\_input\_requests`, we see that the majority of the time is spent in a function called`hash\_feature`, which maps input images to hash\-based IDs so they can be identified cheaply during KV cache lookups\. This is a new code path for multimodal inputs \(text tokens come with a natural ID, their vocab index\) and so we figured it was likely it hadn’t had much optimization attention\.
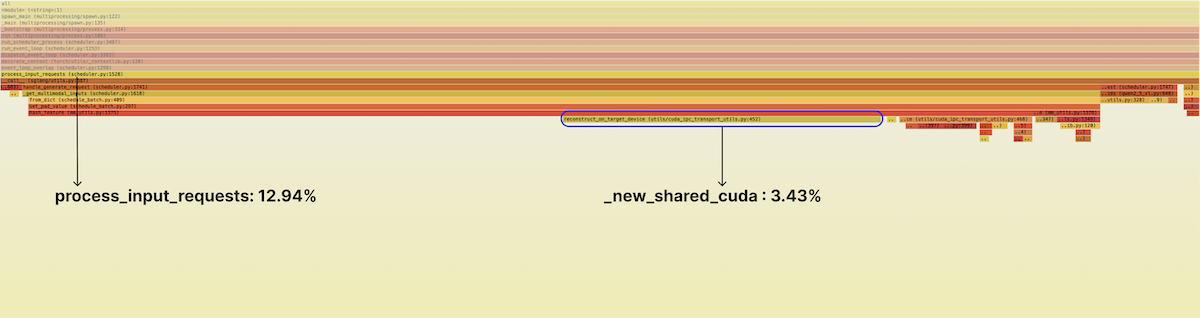
Inside, we see something suspicious\. About 25% of the time in this function, or a bit over 3% of total runtime for the scheduler, is being spent in calls to[`reconstruct\_on\_target\_device`](https://github.com/sgl-project/sglang/blob/83997080a60fb7b2633c764701c4a2ab98389c89/python/sglang/srt/managers/mm_utils.py#L1375)— and from there, on a call to[`torch\.UntypedStorage\.\_new\_shared\_cuda`](https://github.com/sgl-project/sglang/blob/83997080a60fb7b2633c764701c4a2ab98389c89/python/sglang/srt/utils/cuda_ipc_transport_utils.py#L319)\.
So now we need to ask: what is that doing? And can it be faster?
## Avoiding book\-keeping in the hot path with a Python dict
Why shared storage?[Device memory](https://modal.com/gpu-glossary/device-software/global-memory)allocations in[CUDA](https://modal.com/gpu-glossary/device-software/cuda-programming-model)are by default associated with a single process, just like memory allocations in CPU programming\.
SGLang splits work across processes\. For instance, the scheduler orchestrates GPU inference in one process, while one or more tokenizer workers preprocess raw inputs into tensors in parallel in other processes\.
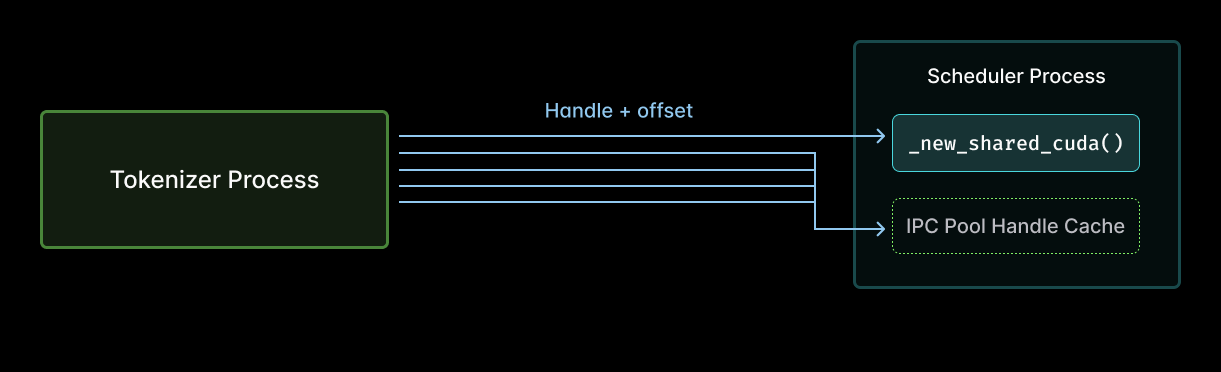
So these tensors must cross the process boundary\. The fastest way to do that for large on\-device tensors in SGLang uses[CUDA Interprocess Communication \(IPC\)](https://docs.nvidia.com/cuda/cuda-programming-guide/04-special-topics/inter-process-communication.html), which avoids copies\. In particular in SGLang, each worker has its own GPU memory pool, every tensor is a slice of that pool, and those tensors are identified by their pool’s handle and an offset in the pool\. That metadata needs to be communicated between the tokenizer processes and the scheduler\.
Reviewing the code in the context of the flamegraph, we realized that the scheduler was calling`\_new\_shared\_cuda`on*every*tensor\. Like this:
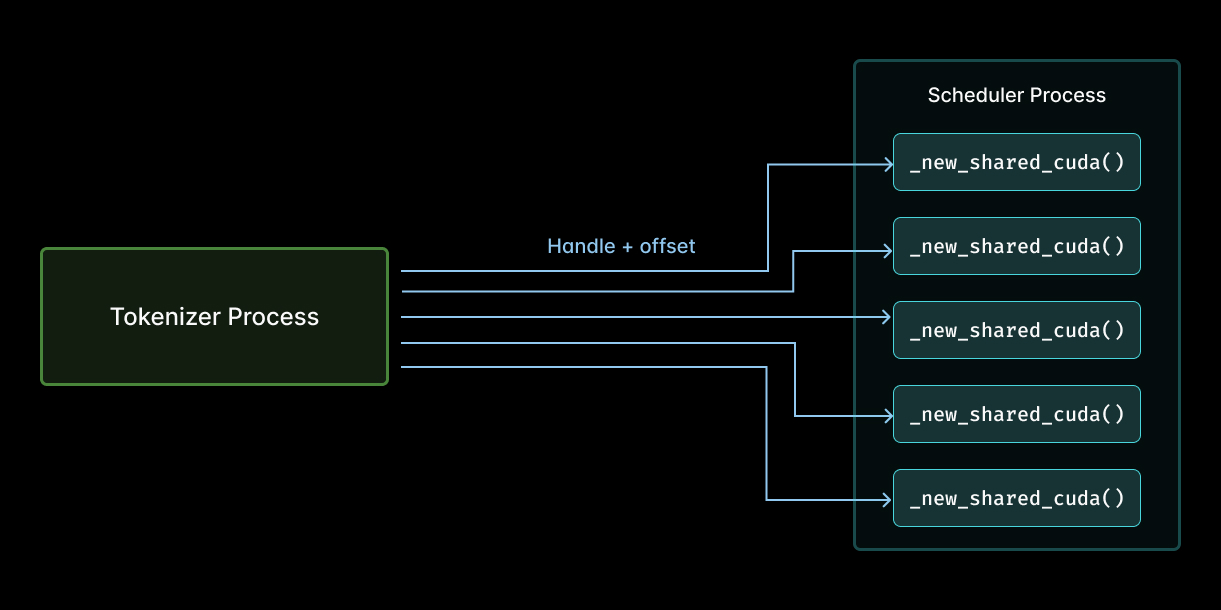
That is, the previous implementation of tensor sharing between a tokenizer process \(left\) and the scheduler \(right\) during multimodal feature hashing required a call to`\_new\_shared\_cuda`for each tensor shared \(arrows\)\.
That means the scheduler was reopening the same few handles over and over, incurring host\-side overhead on book\-keeping each time, only to discard the book at the end of the scheduler iteration\! This work scales with the number of entries in the pool and the number of iterations\. But really, you only need a constant amount of work, one call per pool\.[Do it once, but don’t do it again\!](https://mcjones.ca/docs/performance-mantras/)
What work are we talking about here? At the[CUDA API level](https://modal.com/gpu-glossary/host-software/cuda-runtime-api), repeated opens are cheap \(reference\-counted\)\. So most of the overhead comes from the PyTorch wrapper \- fresh`StorageImpl`, CUDA event recording, GIL interaction, and allocator book\-keeping\. See[this GitHub Issue](https://github.com/pytorch/pytorch/issues/161481)for more details\.
This is a misuse of precious milliseconds, and every millisecond counts\!
The fancy\-sounding “CUDA IPC Pool Handle Cache” is implemented as a simple Python`dict`\. The pools are never reallocated, so cache invalidation is unnecessary\. We also only need a lock when writing to the cache, not when reading it\. And writes are very rare\! The implementation is just:
## Spot\-checking the fix with another flamegraph
We reran`py\-spy`profiling under the same load with the new cache enabled\. The`\_new\_shared\_cuda`hotspot disappeared from the profile, and the total number of samples in input processing was cut by more than half\.
## Measuring end\-to\-end outcomes: 16% more throughput and 10% lower latency
Flamegraphs are nice for debugging performance issues, but they don’t guarantee an end\-to\-end win\. So we went back to our benchmark, Qwen2\.5\-VL\-3B\-Instruct on a single H100\. Below are the results before and after the addition of the pool handle cache\.
Request throughput improved by ~16% and mean end\-to\-end latency dropped ~10%\. Tail latencies improved too\!
MetricHandle Cache OFFHandle Cache ONImprovementThroughput \(req/s\)22\.225\.7\+16\.2%TTFT mean \(ms\)965838\-13\.2%TTFT p99 \(ms\)20581819\-11\.6%TPOT mean \(ms\)7260\-17\.2%ITL p99 \(ms\)627556\-11\.4%E2E latency mean \(ms\)19791768\-10\.6%E2E latency p99 \(ms\)43093666\-14\.9%Details in[the PR](https://github.com/sgl-project/sglang/pull/21418)\.
Our benchmarks used Qwen2\.5\-VL\-3B, but the improvement applies to any multimodal model using SGLang’s CUDA IPC transport\. Benefits should scale with the total number of multimodal inputs\.
### Decode latency improved too\!
One result that is surprising at first blush: average time\-per\-output\-token dropped 17%\. Decoding got faster, even though the fix is entirely in the input/prefill path\. How could that be?
First, with[mixed\-chunk scheduling](https://arxiv.org/abs/2308.16369)enabled, prefill and decode tokens can share a batch, so slowing down the setup of prefill batch elements can also slow down the decodes\.
But the real win is deeper\. Remember, SGLang's scheduler runs on a single thread \-\- one thread to process incoming requests, form batches, and dispatch batches to the GPU\. So[slowness anywhere means slowness everywhere](https://x.com/sama/status/1345140364995227648)\! With everything running on one thread, time spent in`process\_input\_requests`is time not spent dispatching the next batch\.
## This perf improvement is already in released SGLang\. Try it out now\!
The optimization was upstreamed via[`sgl\-project/sglang\#21418`](https://github.com/sgl-project/sglang/pull/21418)and is a part of release[`v0\.5\.10`](https://github.com/sgl-project/sglang/releases/tag/v0.5.10)\. You can enable it, when using CUDA IPC, by adding the following flag:
If you want to try it yourself, our[guide to deploying VLMs with SGLang on Modal](https://modal.com/docs/examples/sglang_vlm)will get you running in minutes\.
*P\.S\. If this is the kind of problem you like solving,[we’re hiring](https://modal.com/careers)\.*