Cached at:
07/06/26, 10:34 PM
# Clouded Judgement 7.3.26 - The End of Compute Scarcity? Not So Fast
Source: [https://cloudedjudgement.substack.com/p/clouded-judgement-7326-the-end-of](https://cloudedjudgement.substack.com/p/clouded-judgement-7326-the-end-of)
Every week I’ll provide updates on the latest trends in cloud software companies\. Follow along to stay up to date\!
**The End of Compute Scarcity? Not So Fast**
I think there are two big questions hitting AI markets right now:
1. If SpaceX \(via xAI\) and Meta are all of a sudden turning around and renting out their compute capacity, are we really in a compute crunch or is the system starting to fill up with excess?
2. What does the rise of open source models and the end of tokenmaxing mean for Anthropic and OpenAI?
On point 1 \- SpaceX famously created ~$2\.32B of monthly revenue by selling \(ie renting out\) about 450k of GPUs to Anthropic, Google and Reflection\. Details below\.
[ Jamin Ball@jaminball SpaceX lands another computing deal, this time with Reflection, an open source model development company\. $150m / month for GB300s\. SpaceX the Neocloud\! Deal 1 with Anthropic Colossus 1 and Colossus 2\. Anthropic took all of Colossus 1 $1\.25b / month ~325k total chips, split 4:43 PM · Jun 22, 2026·49\.9K Views 4 Replies·8 Reposts·120 Likes](https://x.com/jaminball/status/2069099044413304840)Then this week[news broke](https://www.bloomberg.com/news/articles/2026-07-01/meta-is-building-a-cloud-business-to-sell-excess-ai-compute)that Meta is planning to start a cloud computing business selling compute capacity\. Looking at both of these trends \(SpaceX and Meta selling capacity\) you can build a bear narrative:
- There’s excess compute capacity that two of the largest buyers no longer need\. This in turn translates to the end of “scarcity of compute”
- This is the canary in the coal mine for downward capex revisions for the hyperscalers
- Maybe demand simply isn’t there for what’s being built with AI \(Zuckerberg also said this week AI agent tech is developing slower than anticipated\)
I don’t think this bear thesis has legs for a few reasons\. First, let’s look at some of the details of these deals\. Meta hasn’t actually sold anything yet\. On SpaceX \(xAI\), all of their deals are VERY short term in nature\. Each side \(both seller and buyer\) have a 90 day “out” where at any point in the contract they can tap out and stop paying \(or providing the compute\) within 90 days\. The price SpaceX was able to charge was also extraordinarily high\. I believe SpaceX structured the deals this way because they plan on using the compute themselves in the future\. And the buyers \(Anthropic, Google, Reflection\) were willing to pay such high prices because they couldn’t get the capacity anywhere else\.
I also think you need to look at who’s selling the capacity \(SpaceX and Meta\)\. Dario had a great segment on a Dwarkesh podcast talking about the economics of compute buildouts\. In summary, there’s broadly two ways to use compute: training and inference\. And there’s a magic ratio of training / compute that economically makes sense for any given business \(and that ratio will differ by company\)\. Let’s look at either extreme\. If you spend a lot of money on compute, and then use 100% of it for training, you won’t have any left to sell inference and make money\. Or if you use 100% of it for inference you’ll have no capacity left for training and you’re R&D progress is kneecapped and stuck in time\. Neither of these make sense, so there is some middle ground each comapny should deploy\.
Looking at both SpaceX \(xAI\) and Meta\. The unfortunate reality is their models were struggling…xAI basically lost their entire team and usage of their models fell off a cliff\. They themselves had no demand for their own models, so they couldn’t even use their own compute to sell inference\. This mean they had 100% of their compute on the shelf for training, but were also in process of rebuilding their entire team \(I’m speaking in absolutes, but of course there’s more nuance than this, but I think it’s directionally accurate\)\. And as I mentioned above, using 100% of your compute for training is a tough economic proposition\. You’re going to spend a TON of money on the build, but then generate no revenue on the backend\. Not a great trade\. So what did they decide? Again, I’m speaking in conjecture here… They decided until they actually had models to sell, it made economic sense to rent out their capacity so they could bring money in and balance the cashflow equation\. And the short term nature of these compute deals validates this \- they want a 90 day out to take the capacity back when they’re ready for it\. So on SpaceX selling compute, this felt like an idiosyncratic issue they themselves faced\. AND the price they were willing to charge supports that scarcity still exists\.
On Meta \- we don’t exactly know what they’re plans are or what the deals could look like \(so it’s hard to really comment\), but we do know their own AI efforts have been struggling\. Llama models have fallen behind meaningfully \(especially compared to chinese open source models\), and the team / morale issues they’re facing are well documented\. This also could be a “we spent a ton of money on this compute, but aren’t generating enough revenue on it, let’s sell some capacity until we get our act together\.” Again, we don’t actually know what their plans are so it’s hard to comment\. I also think it’s entirely likely they see the business of AWS, Azure and GCP and just want to get into that game\.
So in summary, I really don’t think there is any signal here on “scarcity ending” as from my vantage point there is no excess compute in the system\. Anyone who’s willing to sell capacity \(hyperscalers, neolabs, etc\) finds buyers immediately\. So not to be too glib about it, but I think these deals are nothingburgers on the “scarcity is ending” comments\. AI laggards are just wanting to turn a cost center into a revenue generating opportunity\.
Then we have point two\. Does the rise of open source models and the end of token maxing spell the end of Anthropic and OpenAI’s reign?? No, I don’t think so, but the world is certainly evolving\.[Yippit data](https://x.com/sgtpeppercap/status/2070366345116451284?s=46)also supposedly points to no slow down in the labs revenue trajectory \(but to be fair, if there’s going to be an effect it may just not have hit the P&L yet\)\.
My main reaction to this “fear” is that we have to break down AI usage into two buckets
1. Who is generating the tokens
2. Who is generating the revenue
It would seem these two should be directly correlated, but I actually see a future emerging where 80% of the tokens go to “low cost budget” options \(like cheaper smaller open source models\), and 20% of the tokens go to the “frontier SOTA” tokens from the labs \(where these tokens are way more expensive\)\. In this scenario, I think the 20% will drive a significant portion of the revenue \(because those tokens will be more expensive and for more mission critical work\)\. To date, the “expensive” tokens have capture all of hte market share AND wallet share, but I see these bifurcating in the future\. And this is a good and healthy evolution\. But I deeply believe there will always be a market for frontier tokens, and even if that market is a smaller percentage of total tokens, it will be a big percentage of revenue\.
To some extent we're already seeing something like this show up in enterprise data\. Ramp's latest AI Index shows the top 1% of firms spending ~$7,500 per employee per month on AI while the median firm spends $11\.38 \(which is a huge ~680x gap\)\. The spend is super concentrated in a small group of power users doing serious, mission\-critical work, which is the group I’d imagine reaches for the frontier tokens\. The tokens probably eventually spread out across cheap open source options, but the dollars aggregate / cluster at the top, which is a pattern I’d expect to hold\.
And then there’s the end of tokenmaxing\. This is ABSOLUTELY a trend\. BUT \- I think the tidal wave is too big\. There will certainly be a flushing of wasteful spend that will provide a short term headwind to spending on OpenAI / Anthropic\. BUT I think the macro trend of spending more on intelligence is so large it will overwhelm any optimizations\. I do realize this paragraph is starting to sound a lot like 2021 when a prevailing attitude was “yes software stocks have high multiples, but they’re growing so fast that their growth will overwhelm the inevitable multiple compression\.” \(I probably even said something like that myself…\)\. I’m saying something similar here \- I think we’re so early in the AI S\-Curve that optimizations along the way will look like small blips on the overall trend\.
I think there’s a bigger risk to the large labs that I’ll write about next week\. A broader trend of “own your weights” is emerging that provides an opportunity \(and challenge\) for the big labs\.
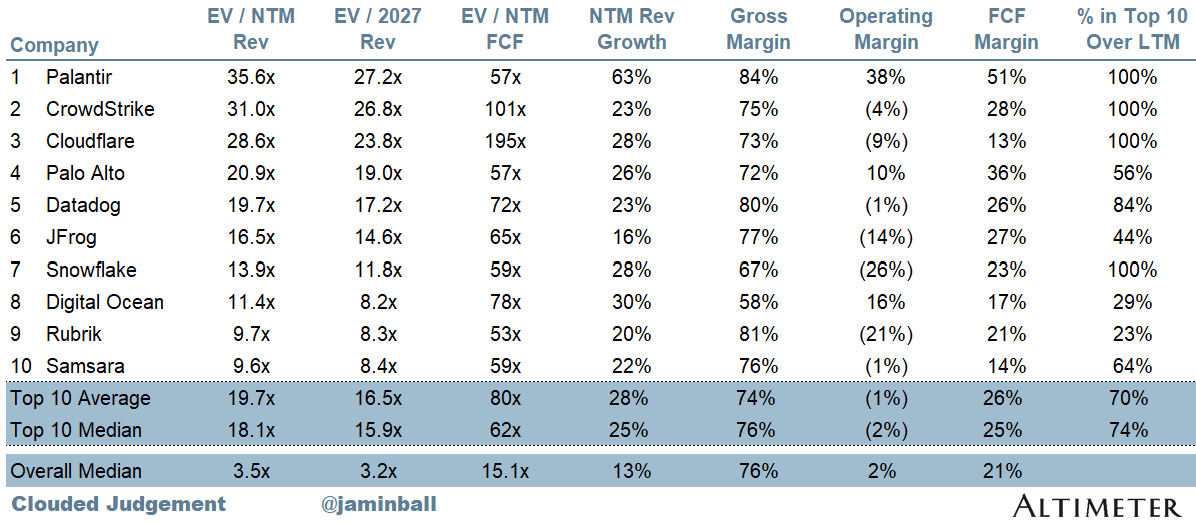
**Top 10 EV / NTM Revenue Multiples**
[](https://substackcdn.com/image/fetch/$s_!vV1x!,f_auto,q_auto:good,fl_progressive:steep/https%3A%2F%2Fsubstack-post-media.s3.amazonaws.com%2Fpublic%2Fimages%2F9198d24d-6aaf-4973-a58e-604a92f42386_1196x524.png)
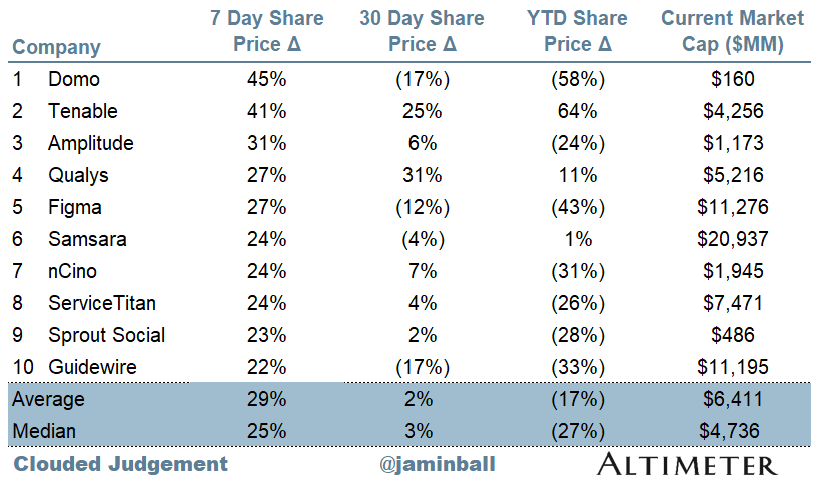
**Top 10 Weekly Share Price Movement**
[](https://substackcdn.com/image/fetch/$s_!zkE6!,f_auto,q_auto:good,fl_progressive:steep/https%3A%2F%2Fsubstack-post-media.s3.amazonaws.com%2Fpublic%2Fimages%2F00b3a6a3-5439-4012-8caa-9db6db8b988d_816x480.png)
**Update on Multiples**
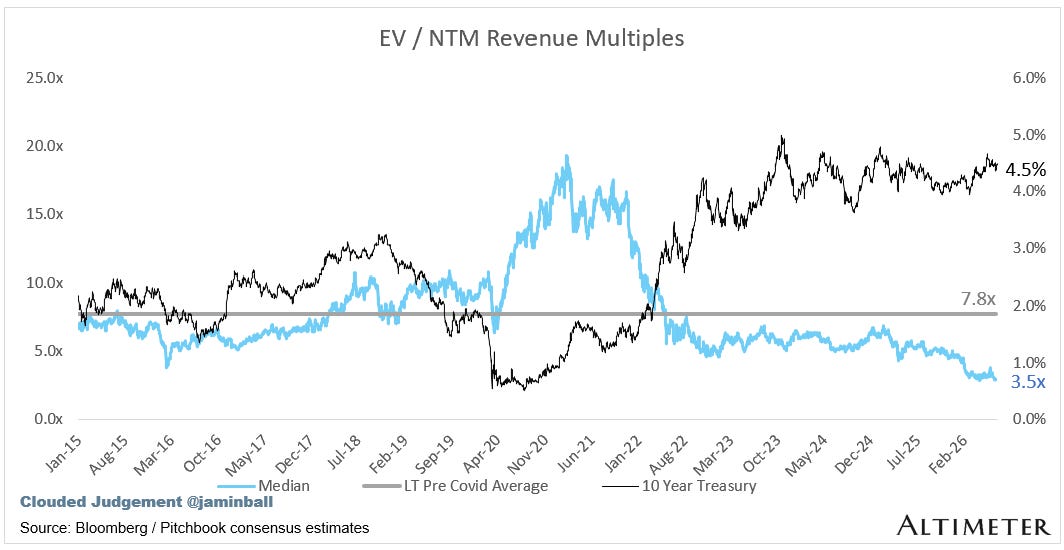
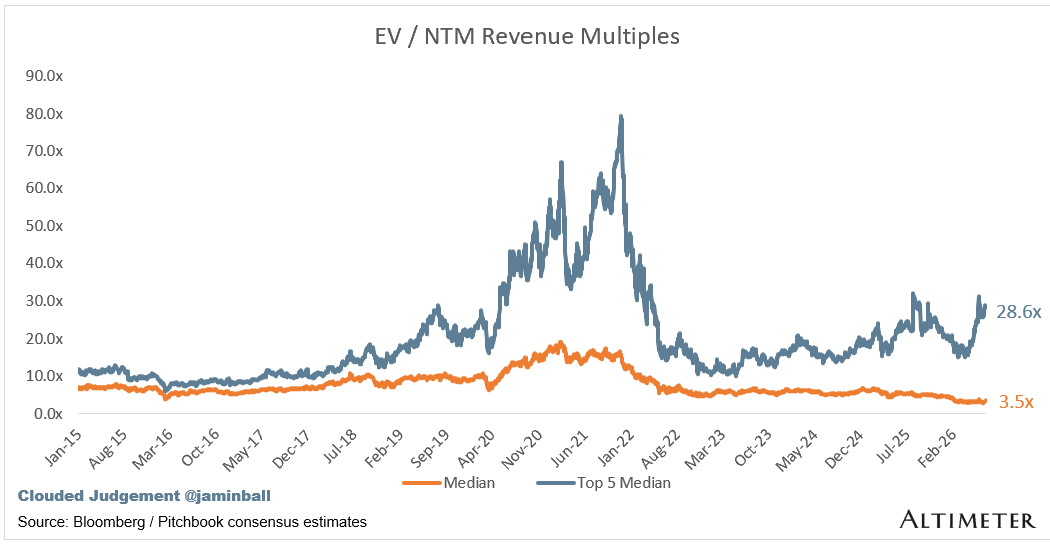
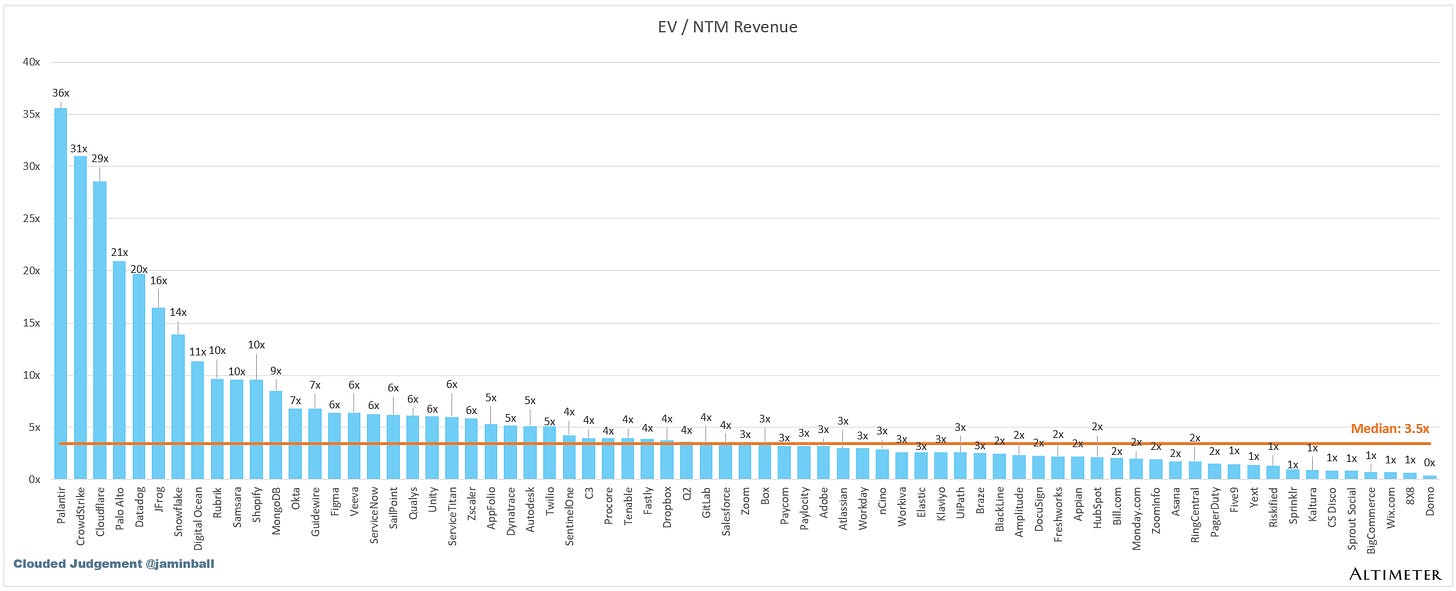
SaaS businesses are generally valued on a multiple of their revenue \- in most cases the projected revenue for the next 12 months\. Revenue multiples are a shorthand valuation framework\. Given most software companies are not profitable, or not generating meaningful FCF, it’s the only metric to compare the entire industry against\. Even a DCF is riddled with long term assumptions\. The promise of SaaS is that growth in the early years leads to profits in the mature years\. Multiples shown below are calculated by taking the Enterprise Value \(market cap \+ debt \- cash\) / NTM revenue\.
Overall Stats:
- Overall Median: 3\.5x
- Top 5 Median: 28\.6x
- 10Y: 4\.5%
[](https://substackcdn.com/image/fetch/$s_!5fur!,f_auto,q_auto:good,fl_progressive:steep/https%3A%2F%2Fsubstack-post-media.s3.amazonaws.com%2Fpublic%2Fimages%2F24f7c5c7-8725-484e-9794-e1e4216feaab_1064x550.png)
[](https://substackcdn.com/image/fetch/$s_!SBVs!,f_auto,q_auto:good,fl_progressive:steep/https%3A%2F%2Fsubstack-post-media.s3.amazonaws.com%2Fpublic%2Fimages%2F3a7ab77e-5586-44c2-8754-b746b67d4877_1050x544.png)
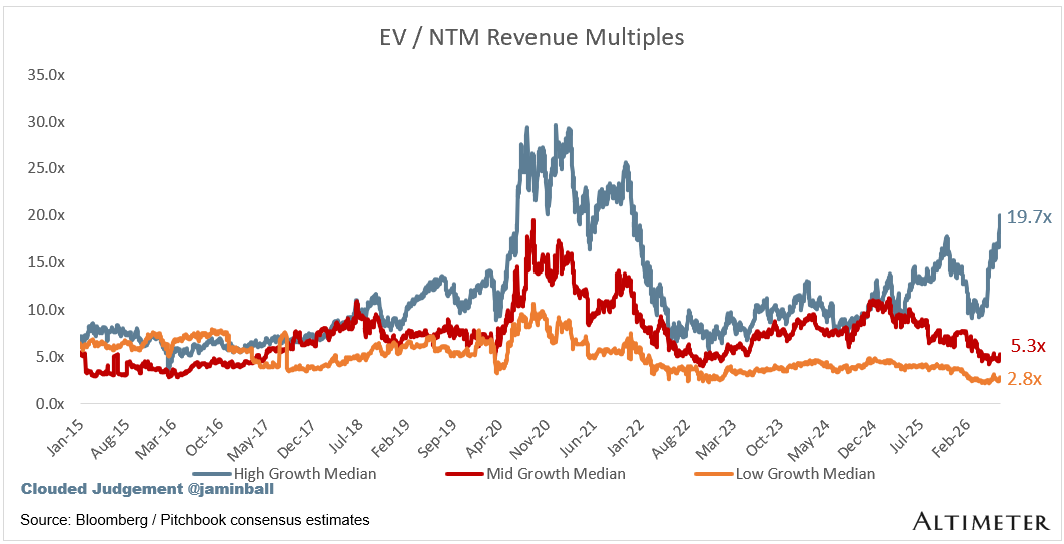
Bucketed by Growth\. In the buckets below I consider high growth \>22% projected NTM growth, mid growth 15%\-22% and low growth <15%\. I had to adjusted the cut off for “high growth\.” If 22% feels a bit arbitrary, it’s because it is…I just picked a cutoff where there were ~10 companies that fit into the high growth bucket so the sample size was more statistically significant
- High Growth Median: 19\.7x
- Mid Growth Median: 5\.3x
- Low Growth Median: 2\.8x
[](https://substackcdn.com/image/fetch/$s_!DXk1!,f_auto,q_auto:good,fl_progressive:steep/https%3A%2F%2Fsubstack-post-media.s3.amazonaws.com%2Fpublic%2Fimages%2F4c2277af-b72e-476a-b02b-7751385d8b93_1064x544.png)
[](https://substackcdn.com/image/fetch/$s_!87w0!,f_auto,q_auto:good,fl_progressive:steep/https%3A%2F%2Fsubstack-post-media.s3.amazonaws.com%2Fpublic%2Fimages%2F9c44b520-c9a5-478a-9d1a-347d32d5950b_2064x838.png)
**EV / NTM Rev / NTM Growth**
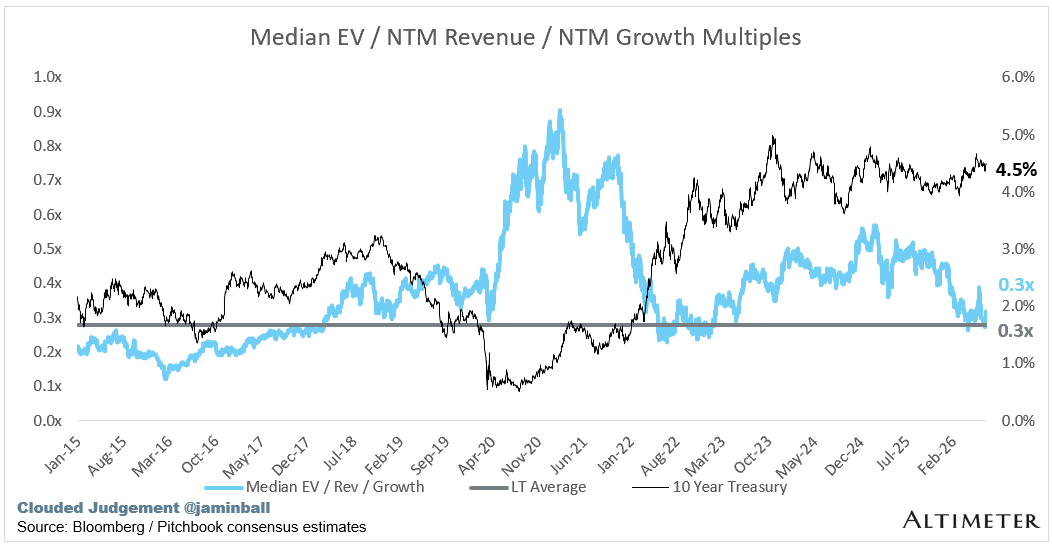
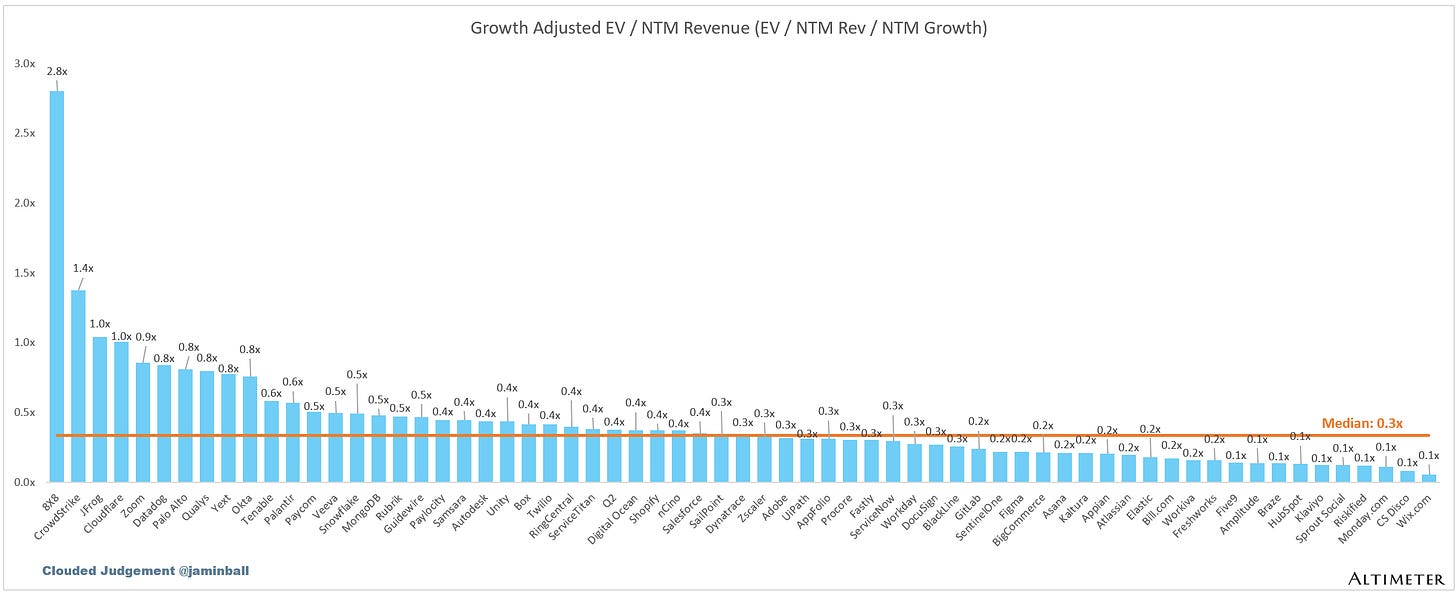
The below chart shows the EV / NTM revenue multiple divided by NTM consensus growth expectations\. So a company trading at 20x NTM revenue that is projected to grow 100% would be trading at 0\.2x\. The goal of this graph is to show how relatively cheap / expensive each stock is relative to its growth expectations\.
[](https://substackcdn.com/image/fetch/$s_!ioLI!,f_auto,q_auto:good,fl_progressive:steep/https%3A%2F%2Fsubstack-post-media.s3.amazonaws.com%2Fpublic%2Fimages%2Ff29c979f-bcf4-4584-8eec-65f00459a82c_1052x548.png)
[](https://substackcdn.com/image/fetch/$s_!j622!,f_auto,q_auto:good,fl_progressive:steep/https%3A%2F%2Fsubstack-post-media.s3.amazonaws.com%2Fpublic%2Fimages%2Fa5440d12-9102-4149-8292-aafbccc69e6f_2434x994.png)
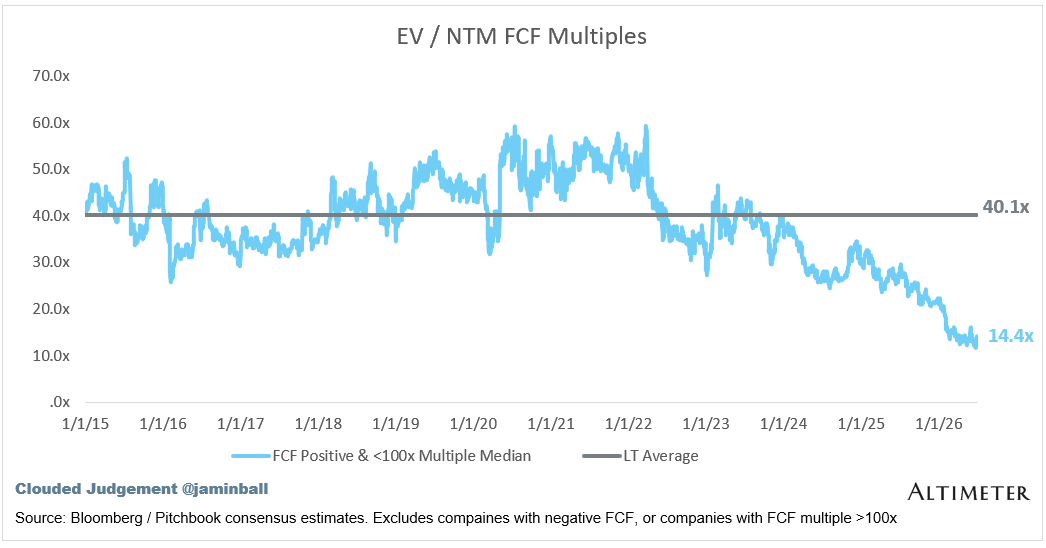
**EV / NTM FCF**
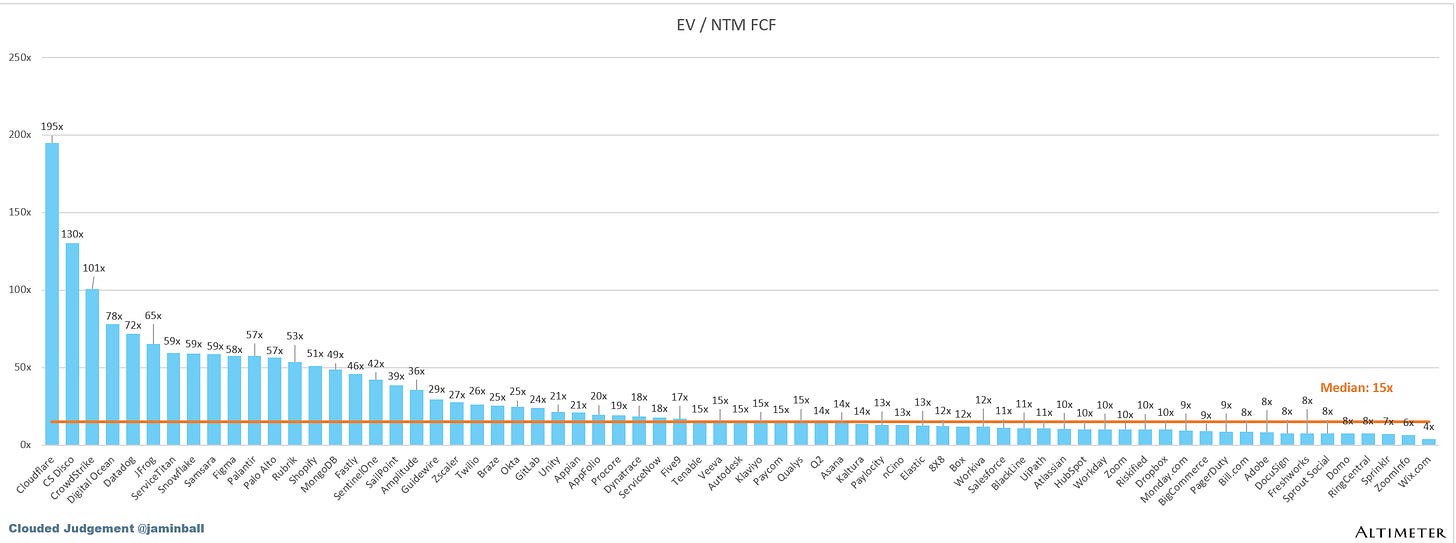
The line chart shows the median of all companies with a FCF multiple \>0x and <100x\. I created this subset to show companies where FCF is a relevant valuation metric\.
[](https://substackcdn.com/image/fetch/$s_!Zg82!,f_auto,q_auto:good,fl_progressive:steep/https%3A%2F%2Fsubstack-post-media.s3.amazonaws.com%2Fpublic%2Fimages%2Ff3eb83bc-324e-4f7b-8eb6-10a97aff95b1_1046x548.png)
Companies with negative NTM FCF are not listed on the chart
[](https://substackcdn.com/image/fetch/$s_!vIwy!,f_auto,q_auto:good,fl_progressive:steep/https%3A%2F%2Fsubstack-post-media.s3.amazonaws.com%2Fpublic%2Fimages%2F3cc2e5b9-4401-4b05-b9f0-481cf0fe86af_2572x960.png)
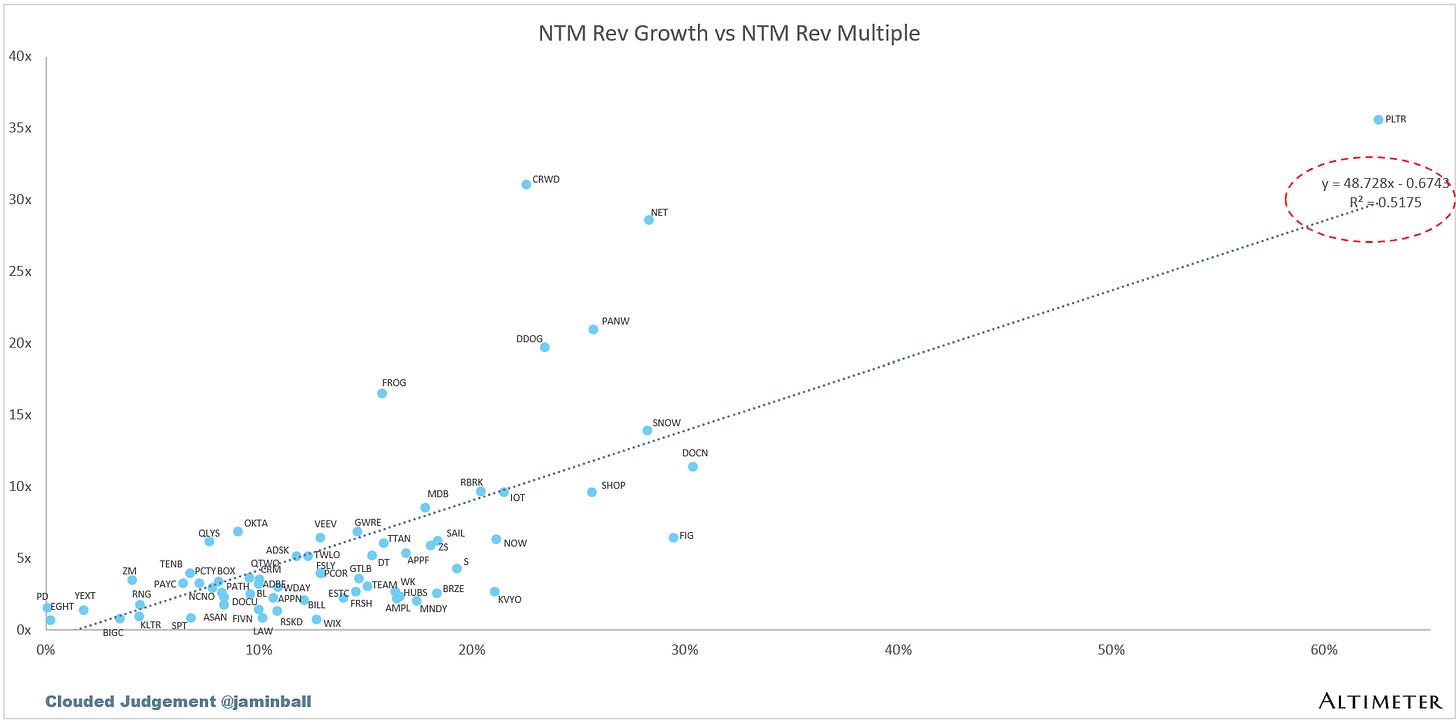
**Scatter Plot of EV / NTM Rev Multiple vs NTM Rev Growth**
How correlated is growth to valuation multiple?
[](https://substackcdn.com/image/fetch/$s_!WOzR!,f_auto,q_auto:good,fl_progressive:steep/https%3A%2F%2Fsubstack-post-media.s3.amazonaws.com%2Fpublic%2Fimages%2F7978c90d-f788-4cb0-b918-e87635744f6d_1888x938.png)
**Operating Metrics**
- Median NTM growth rate: 13%
- Median LTM growth rate: 16%
- Median Gross Margin: 76%
- Median Operating Margin 2%
- Median FCF Margin: 21%
- Median Net Retention: 110%
- Median CAC Payback: 44 months
- Median S&M % Revenue: 34%
- Median R&D % Revenue: 23%
- Median G&A % Revenue: 13%
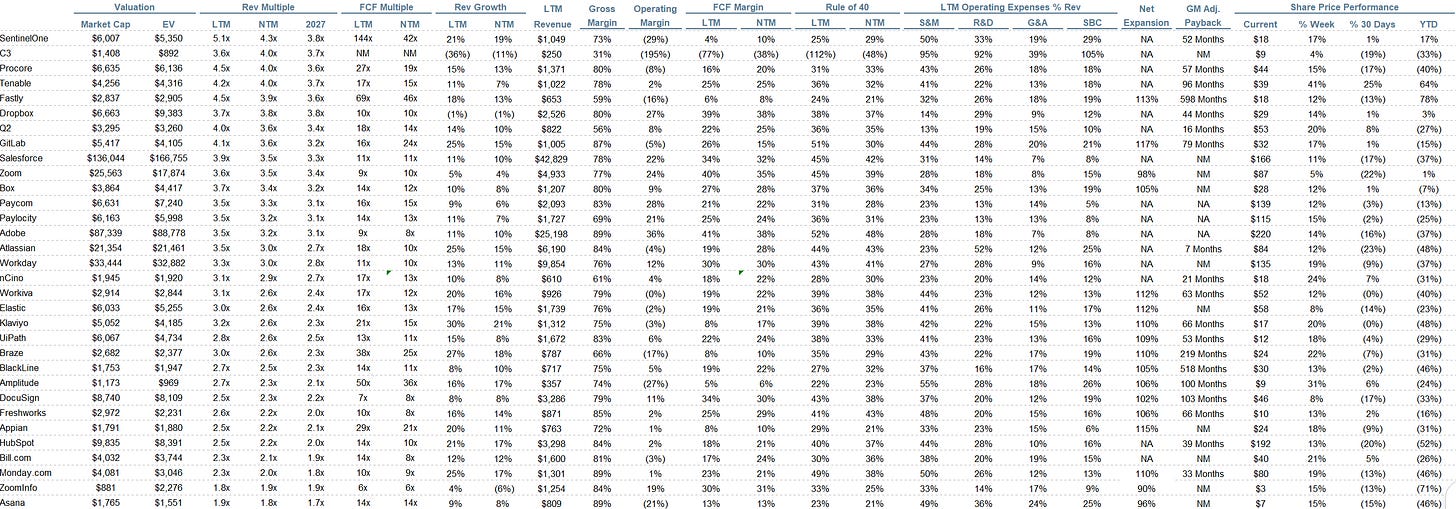
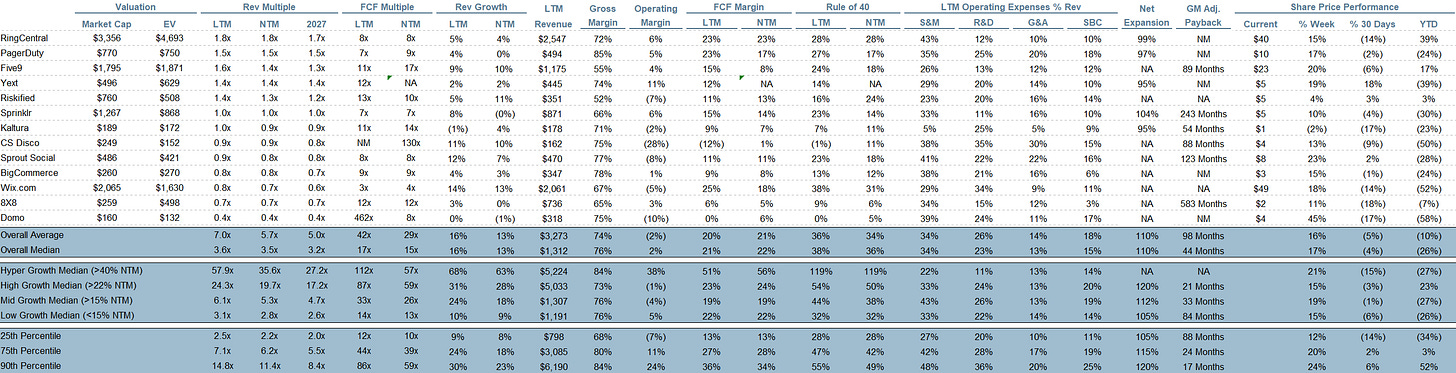
**Comps Output**
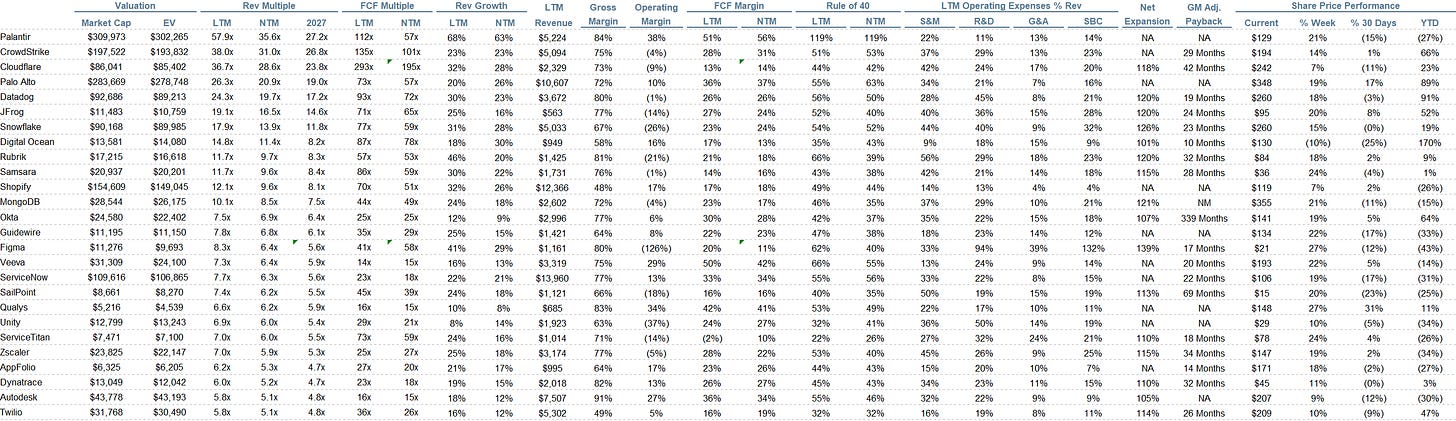
Rule of 40 shows rev growth \+ FCF margin \(both LTM and NTM for growth \+ margins\)\. FCF calculated as Cash Flow from Operations \- Capital Expenditures
GM Adjusted Payback is calculated as: \(Previous Q S&M\) / \(Net New ARR in Q x Gross Margin\) x 12\. It shows the number of months it takes for a SaaS business to pay back its fully burdened CAC on a gross profit basis\. Most public companies don’t report net new ARR, so I’m taking an implied ARR metric \(quarterly subscription revenue x 4\)\. Net new ARR is simply the ARR of the current quarter, minus the ARR of the previous quarter\. Companies that do not disclose subscription rev have been left out of the analysis and are listed as NA\.
[](https://substackcdn.com/image/fetch/$s_!KXfm!,f_auto,q_auto:good,fl_progressive:steep/https%3A%2F%2Fsubstack-post-media.s3.amazonaws.com%2Fpublic%2Fimages%2Fa79d0961-8a1f-4d63-80b8-082ccf8b5dd0_2622x758.png)
[](https://substackcdn.com/image/fetch/$s_!1pjP!,f_auto,q_auto:good,fl_progressive:steep/https%3A%2F%2Fsubstack-post-media.s3.amazonaws.com%2Fpublic%2Fimages%2Ffc7e02d9-6def-499d-8a0b-b3aa5223fdf3_2624x918.png)
[](https://substackcdn.com/image/fetch/$s_!m5RE!,f_auto,q_auto:good,fl_progressive:steep/https%3A%2F%2Fsubstack-post-media.s3.amazonaws.com%2Fpublic%2Fimages%2F1f33d1d1-df81-43fd-b79a-2db4e00e2f68_2626x672.png)
Sources used in this post include Bloomberg, Pitchbook and company filings
The information presented in this newsletter is the opinion of the author and does not necessarily reflect the view of any other person or entity, including Altimeter Capital Management, LP \(”Altimeter”\)\. The information provided is believed to be from reliable sources but no liability is accepted for any inaccuracies\. This is for information purposes and should not be construed as an investment recommendation\. Past performance is no guarantee of future performance\. Altimeter is an investment adviser registered with the U\.S\. Securities and Exchange Commission\. Registration does not imply a certain level of skill or training\. Altimeter and its clients trade in public securities and have made and/or may make investments in or investment decisions relating to the companies referenced herein\. The views expressed herein are those of the author and not of Altimeter or its clients, which reserve the right to make investment decisions or engage in trading activity that would be \(or could be construed as\) consistent and/or inconsistent with the views expressed herein\.
**This post and the information presented are intended for informational purposes only\.**The views expressed herein are the author’s alone and do not constitute an offer to sell, or a recommendation to purchase, or a solicitation of an offer to buy, any security, nor a recommendation for any investment product or service\. While certain information contained herein has been obtained from sources believed to be reliable, neither the author nor any of his employers or their affiliates have independently verified this information, and its accuracy and completeness cannot be guaranteed\. Accordingly, no representation or warranty, express or implied, is made as to, and no reliance should be placed on, the fairness, accuracy, timeliness or completeness of this information\. The author and all employers and their affiliated persons assume no liability for this information and no obligation to update the information or analysis contained herein in the future\.
[Share Clouded Judgement](https://cloudedjudgement.substack.com/?utm_source=substack&utm_medium=email&utm_content=share&action=share)
[Leave a comment](https://cloudedjudgement.substack.com/p/clouded-judgement-7326-the-end-of/comments)
#### Discussion about this post
### Ready for more?