Cached at:
07/04/26, 06:51 PM
# US and Chinese companies train almost all of the world’s most-used AI models
Source: [https://ourworldindata.org/data-insights/us-and-chinese-companies-train-almost-all-of-the-worlds-most-used-ai-models](https://ourworldindata.org/data-insights/us-and-chinese-companies-train-almost-all-of-the-worlds-most-used-ai-models)
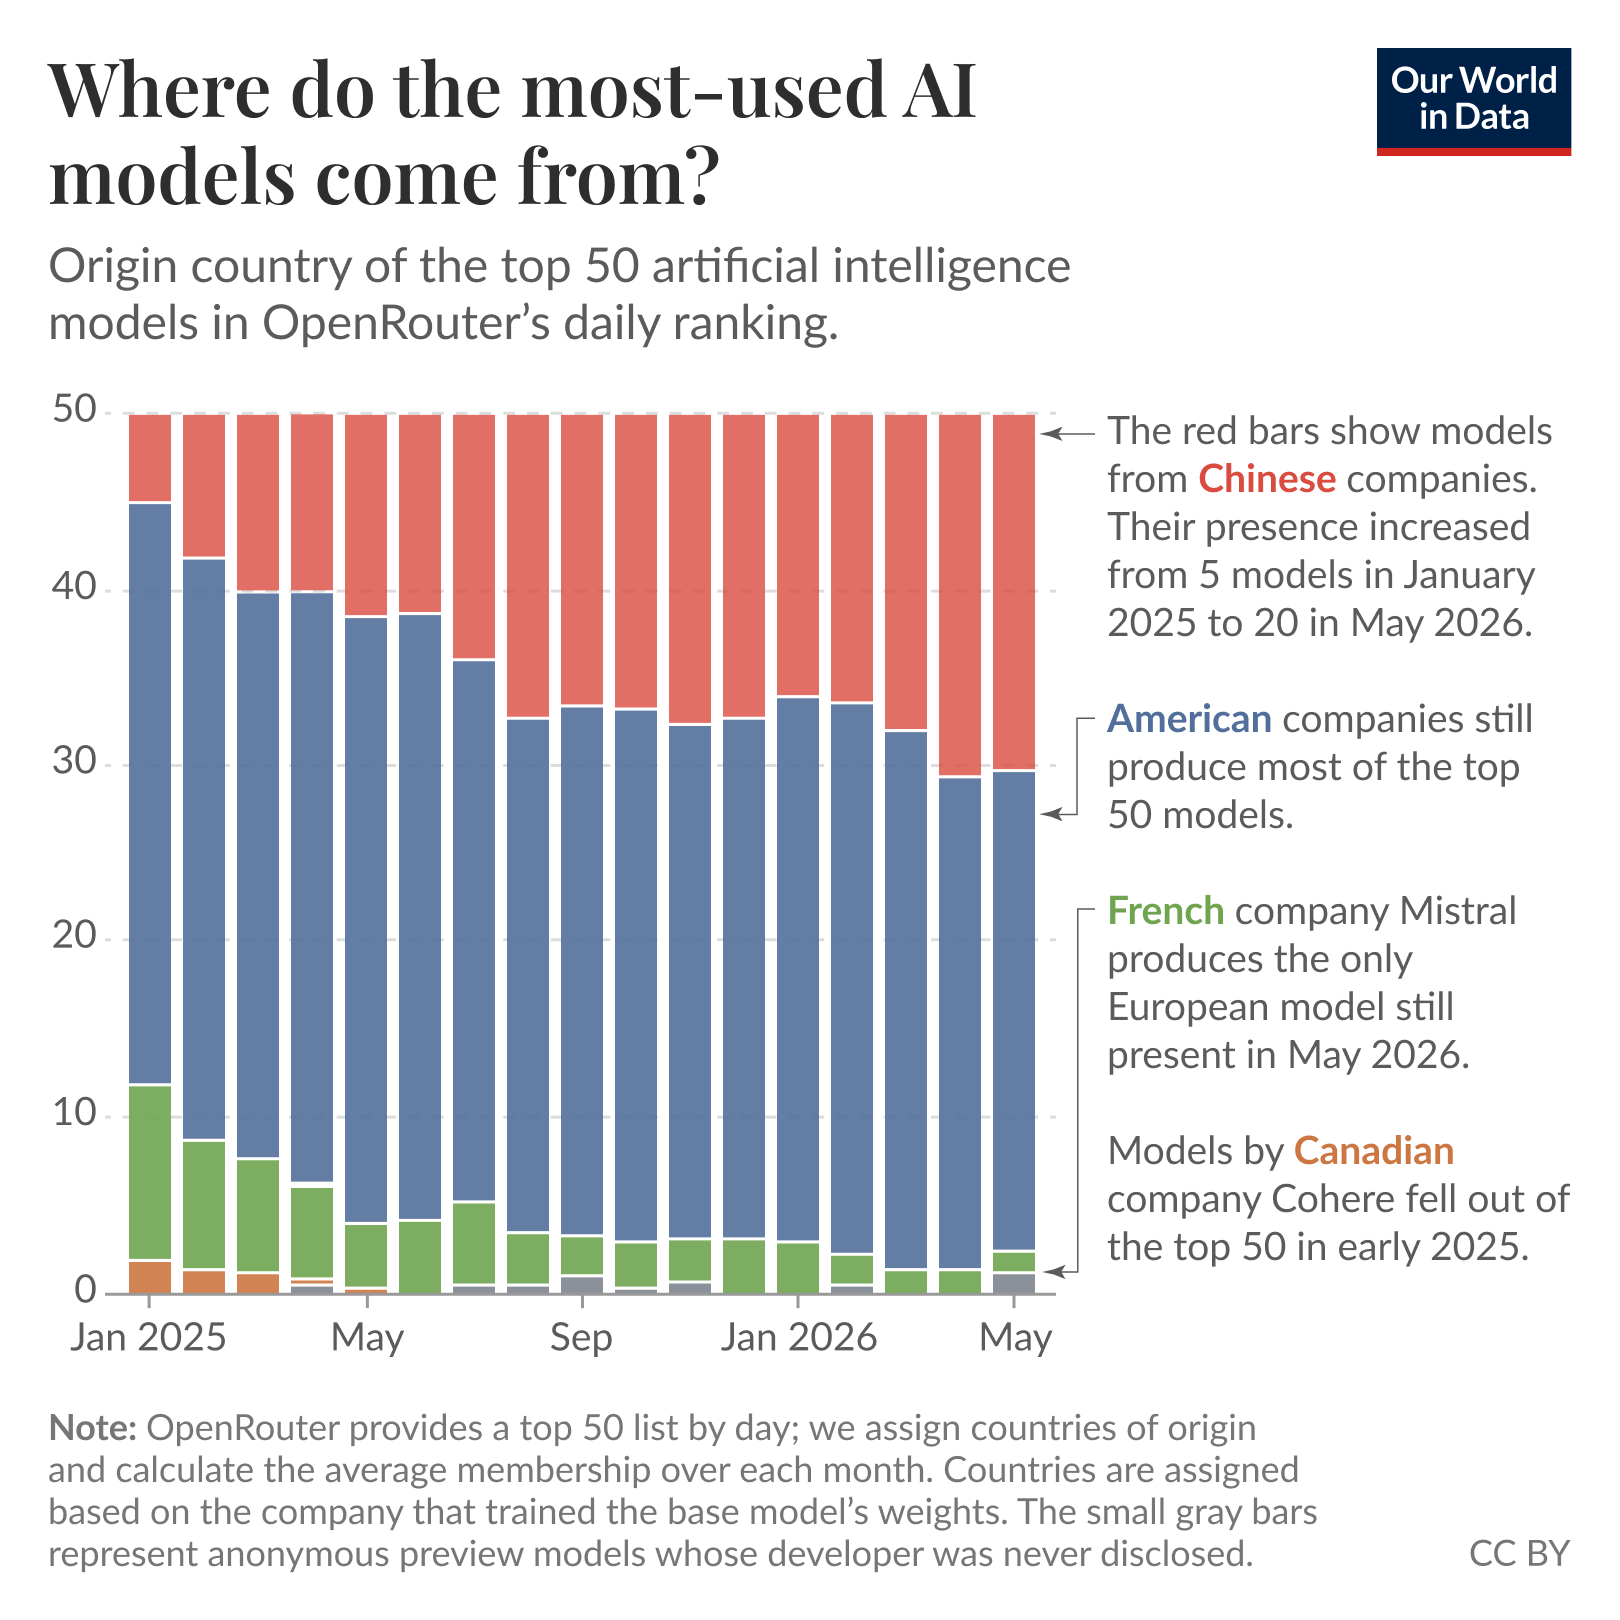
Dozens of companies worldwide develop large AI models, but it can be difficult to get a sense of where the most\-used ones tend to come from\.
OpenRouter is a large platform that allows users to interact with and write software on top of AI models through a single interface\. It includes all the models from large companies like Google, OpenAI, Anthropic, Meta, DeepSeek, and Alibaba, as well as many, many others\.
I analyzed the data published by OpenRouter on the 50 most used models each day since January 2025 and calculated the average monthly presence by origin country of the models\.
As you can see on the chart, US\-based companies still account for most models in OpenRouter’s top 50\. But their presence has declined, and China\-based companies have grown rapidly, from 5 models in the daily top 50 at the beginning of 2025 to 20 in May 2026\.
Very few top\-50 models come from companies outside the United States and China\. Canada was represented early in 2025 by Cohere’s Command R models, while France remains represented by Mistral AI’s NeMo model\.
A technology that more people use every year is, so far, almost entirely the product of two countries\.
## Our latest Data Insights
[See all Data Insights](https://ourworldindata.org/latest?type=data-insight)- [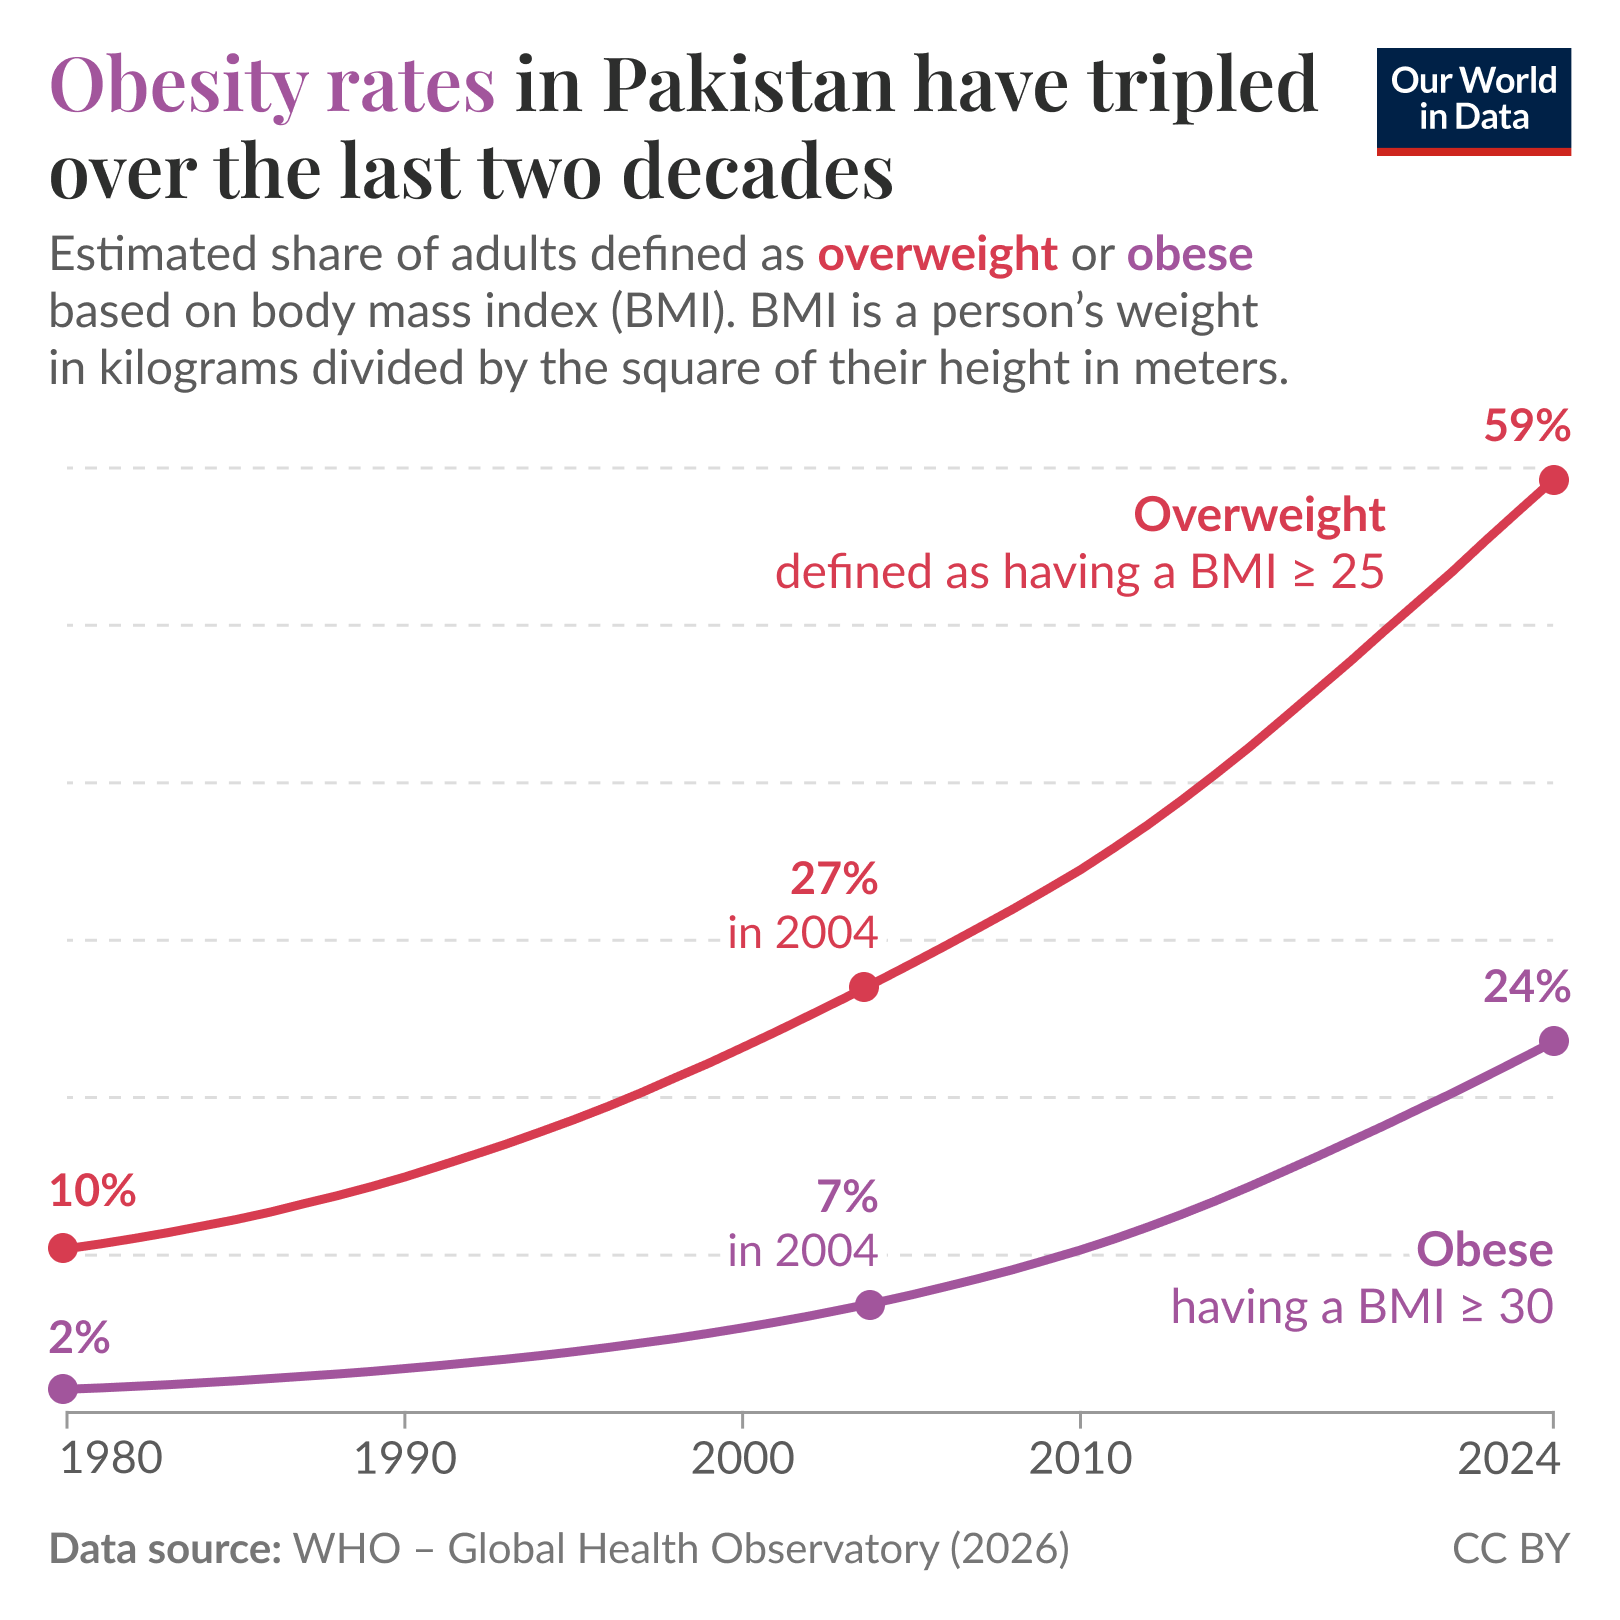 June 27 ### Obesity rates in Pakistan have tripled in the last 20 years Hannah Ritchie In the 20th century, obesity was a health problem thatmostly affectedtoday’s rich countries\. In the 21st century, it has emerged as a health challenge almost everywhere\. Many low\- and middle\-income countries have seen rapid increases in the share of people defined as overweight or obese\. In the chart, you can see this rise for Pakistan\. In the last 20 years, the share of adults defined as overweight has more than doubled, and the share defined as obese has more than tripled\. Now, almost 60% of adults are overweight, and one\-quarter are obese\. These are modeled estimates from the World Health Organization based on national surveys of height and weight\. Body Mass Index \(BMI\) is a person’s weight in kilograms divided by the square of their height in meters\. An adult is defined as overweight if their BMI is 25 or greater, and obese at 30 or greater\. Pakistan’s own domestic surveys often report even higher figures; that’s because they have a lower BMI threshold for being overweight and obese, which reflects the fact that South Asian populations canhave higher health risksat a lower level of BMI\. Obesity is a health problem because itincreases the riskof developing a range of conditions, such as cardiovascular disease, strokes, diabetes, and various cancers\. Explore how obesity rates have changed in your own country](https://ourworldindata.org/data-insights/obesity-rates-in-pakistan-have-tripled-in-the-last-20-years)
- [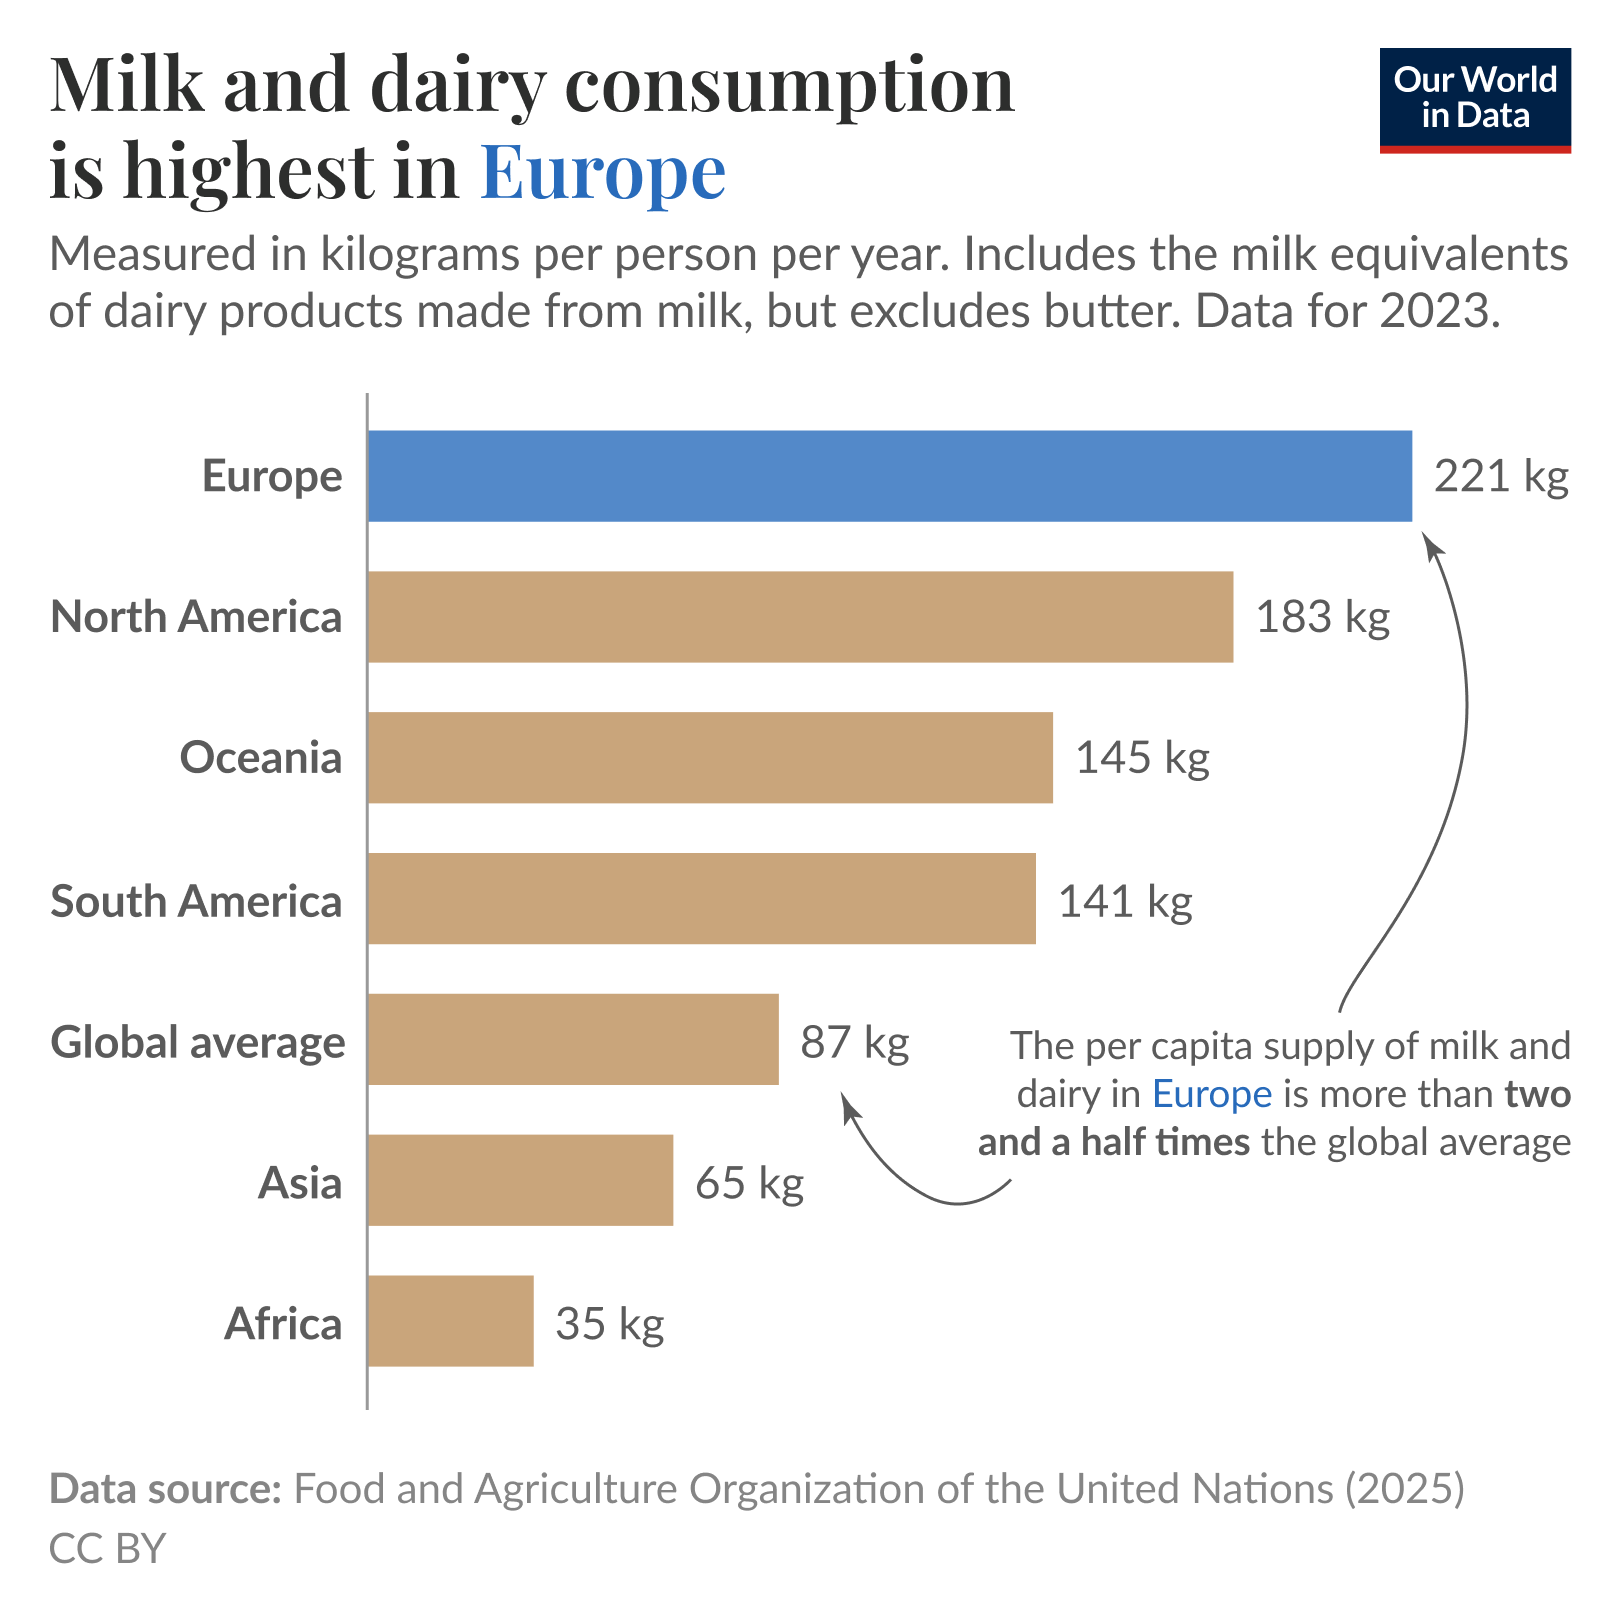 June 25 ### Europeans consume more milk and dairy products than people in other regions Hannah Ritchie and Pablo Arriagada In Europe, the supply of dairy products is far higher than in other parts of the world\. This chart shows milk supply per person across the world’s regions, with data from the Food and Agriculture Organization of the United Nations\. It’s based on supply — the amount of milk available for consumption — which includes consumer waste, so it is slightly higher than the amount that people actually consume\. As you can see, the per capita supply in Europe is more than two and a half times the global average\. People across Africa and Asia have far less available\. These numbers include dairy products such as yogurt and cheese, based on how much milk is used to produce them, but they do not include butter\. Explore country\-by\-country data on milk supply](https://ourworldindata.org/data-insights/europeans-consume-more-milk-and-dairy-products-than-in-other-regions)
- [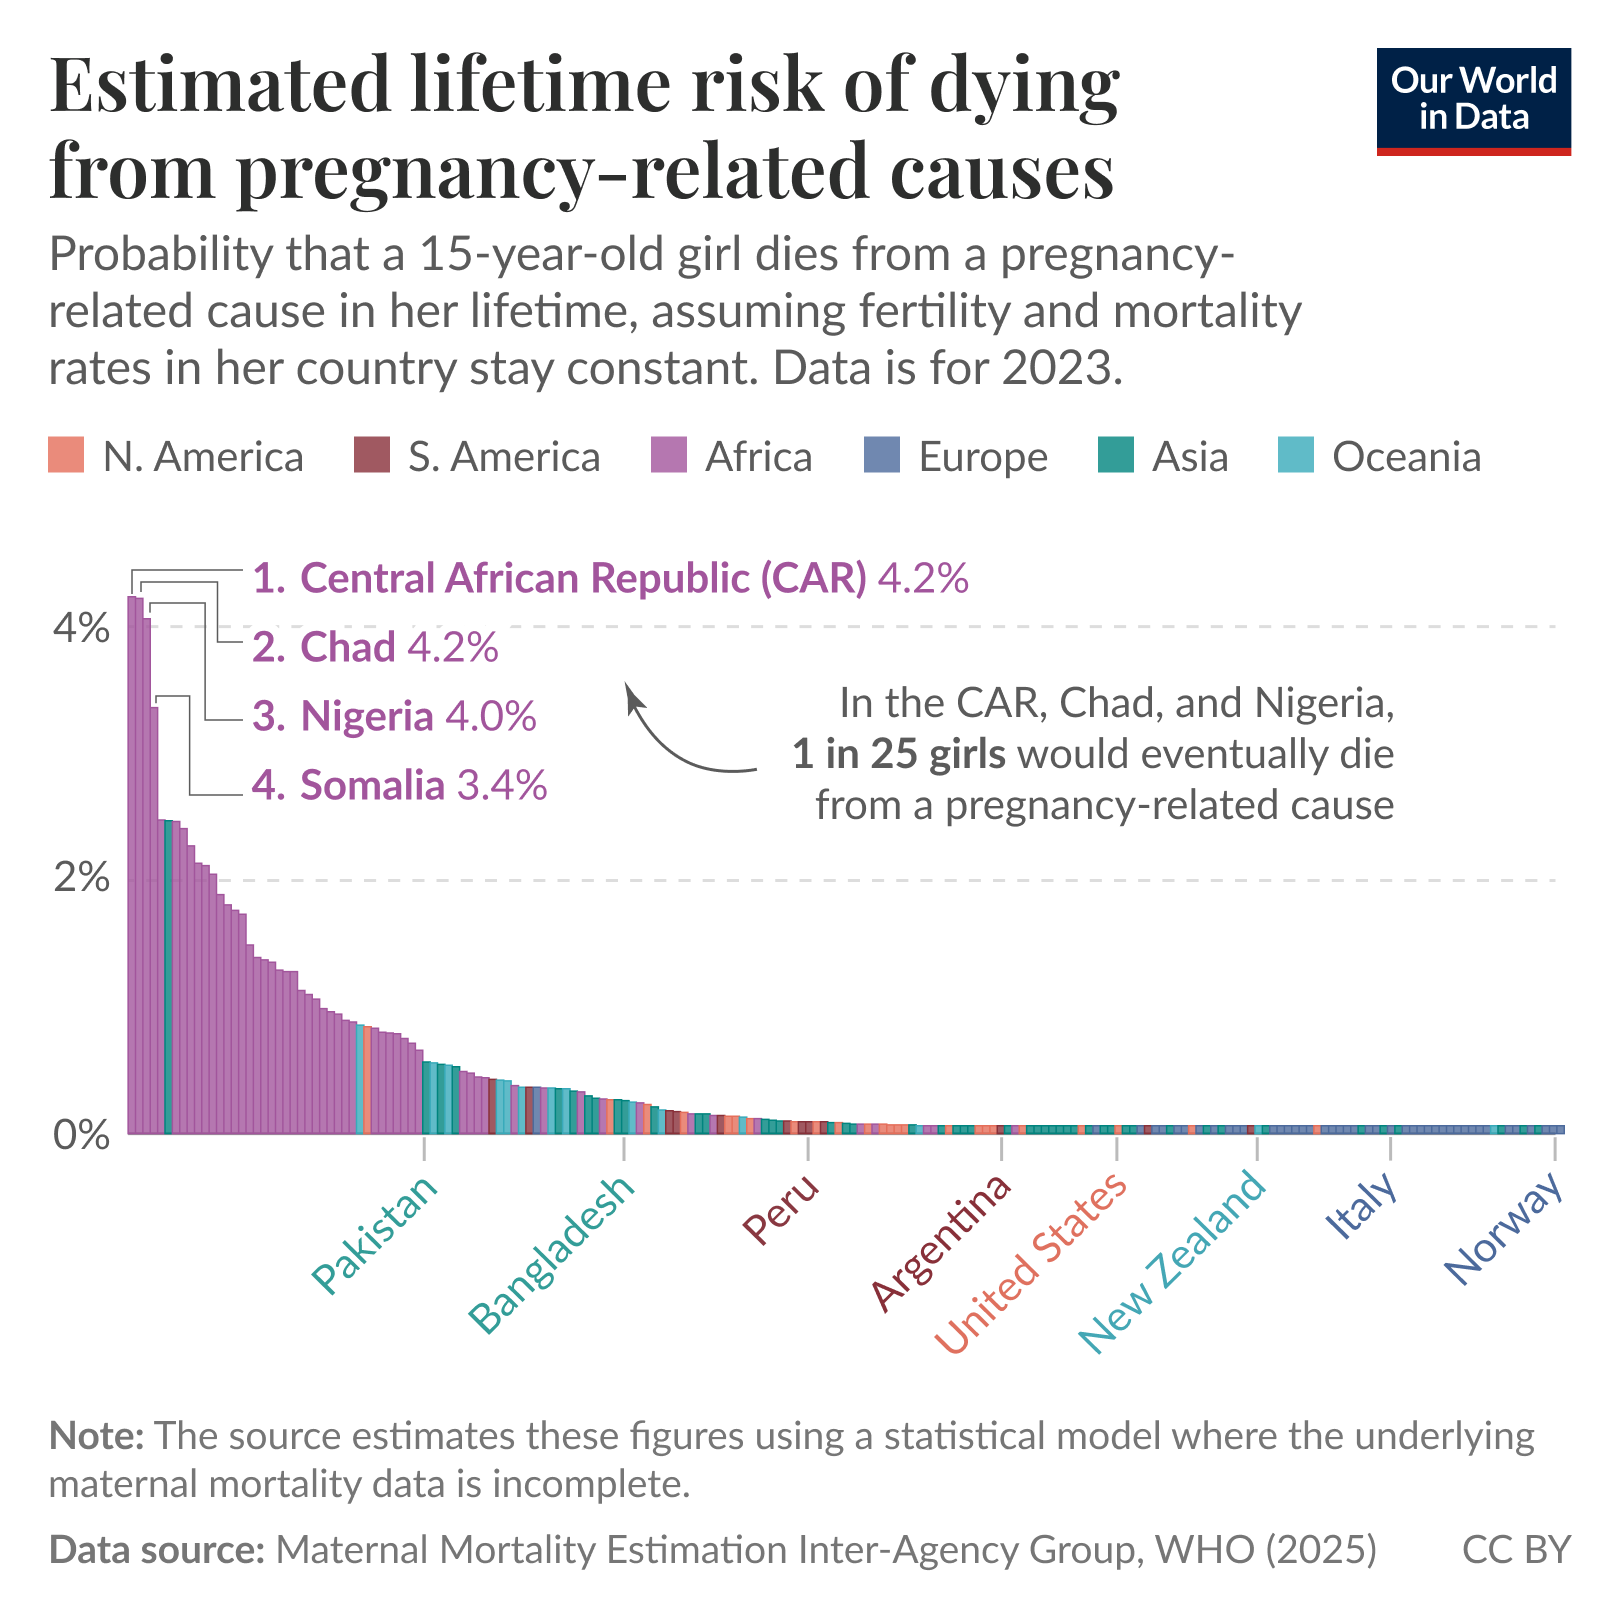 June 23 ### A woman’s risk of dying in pregnancy or childbirth varies hugely by country Esteban Ortiz\-Ospina How likely is it that a 15\-year\-old girl will eventually die from a pregnancy\-related cause? Researchers at the UN and the World Bank combined available birth and mortality data with statistical models to answer this question\. Their estimates assume that the country’s fertility and mortality rates remain constant throughout the teenager’s lifetime \(an important assumption I’ll get to later\)\. The chart shows their results\. In Chad, the Central African Republic, and Nigeria, the estimated lifetime risk is around 4%\. This is dire: it means about 1 in 25 girls would eventually die from a pregnancy\-related cause\. Women in many other African countries also face substantial risks, and much of Sub\-Saharan Africa has a rate above 1%\. By comparison, estimates in most other regions are considerably lower, and across Europe the risk is below 0\.1%\. The very high risks for the countries on the left of the chart reflect two factors that compound: they have some ofthe highestmaternal mortality rates in the world, and the average number of births per woman in these countries isalso high\. They face a high mortality risk per pregnancy, multiplied by five or six pregnancies over a lifetime\. Maternal mortalityrates per pregnancyandfertility ratesare falling in these countries\. Both of these declines would substantially reduce the lifetime risks\. The results in the chart assume they stay at current levels, but that doesn’t have to be the case\. Explore the data and read more about maternal mortality trends and what has driven progress in other countries](https://ourworldindata.org/data-insights/a-womans-risk-of-dying-in-pregnancy-or-childbirth-varies-hugely-by-country)
- [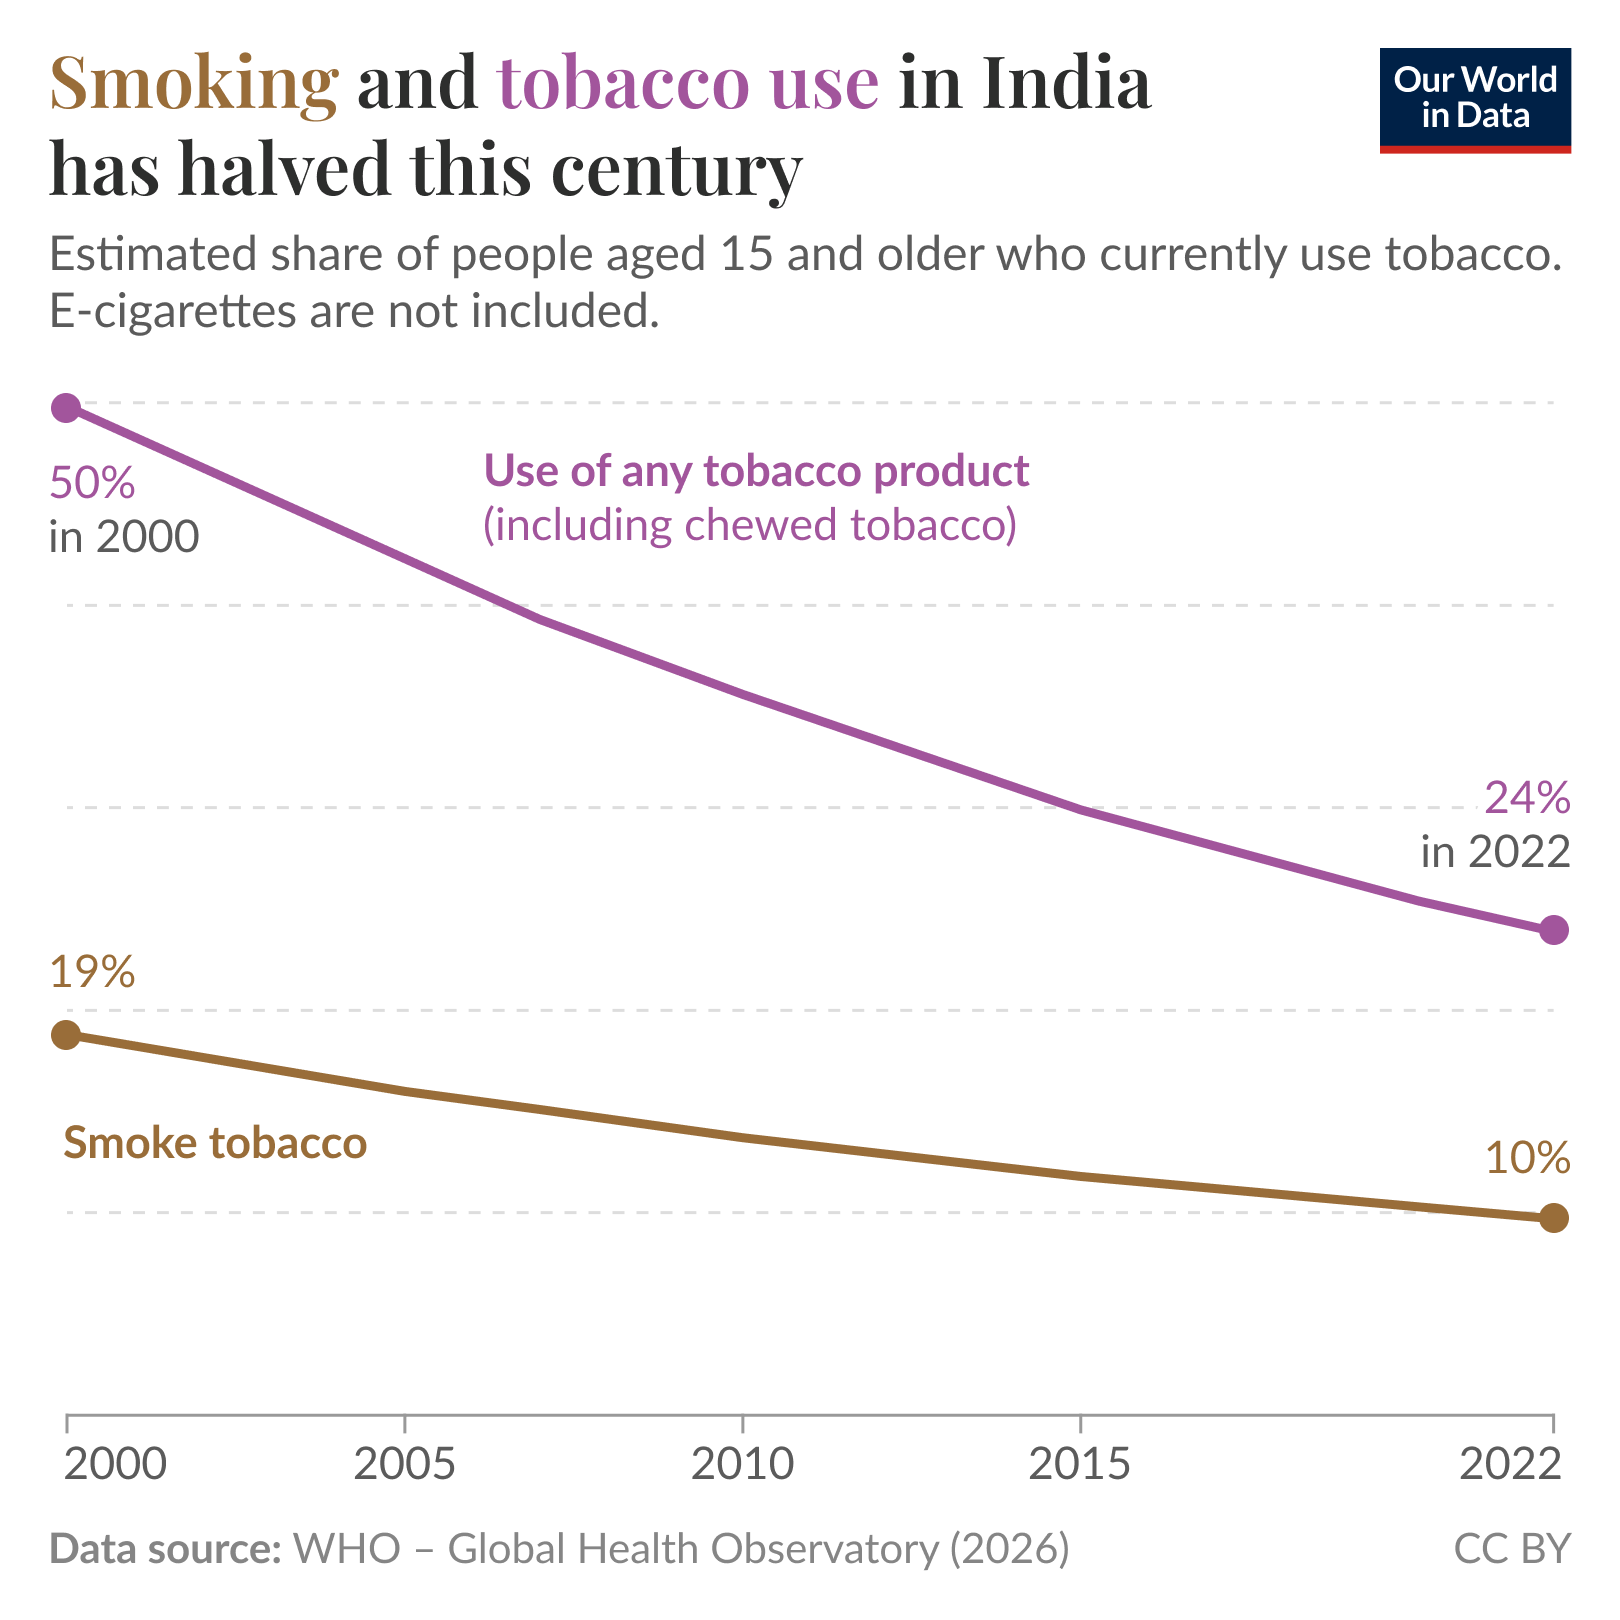 June 20 ### Tobacco use in India has halved this century Hannah Ritchie At the turn of the millennium, one\-in\-five adults in India smoked tobacco, and almost half of all adults were using any form of tobacco, including products that are chewed or sniffed\. But over the past two decades, rates of both have roughly halved\. You can see this in the chart\. Some countries have seen a decline in smoking among men, but a rise among women\. This is not the case in India: tobacco use hasfallen substantiallyfor both sexes\. This decline has huge implications\. Each year, smoking causesalmost one million Indiansto die earlier than they otherwise would\. Since smoking\-related diseases can take decades to develop, this recent decline in smoking rates will result in fewer deaths in the future\. Smokeless tobacco tends to have lower health risks because people are not inhaling smoke\. But it stillincreases the riskof oral, throat, and esophageal cancers, gum disease, and other conditions\. Read my colleague Max Roser’s article on the scale of the global smoking problem, and how we make progress against it](https://ourworldindata.org/data-insights/tobacco-use-in-india-has-halved-this-century)
- [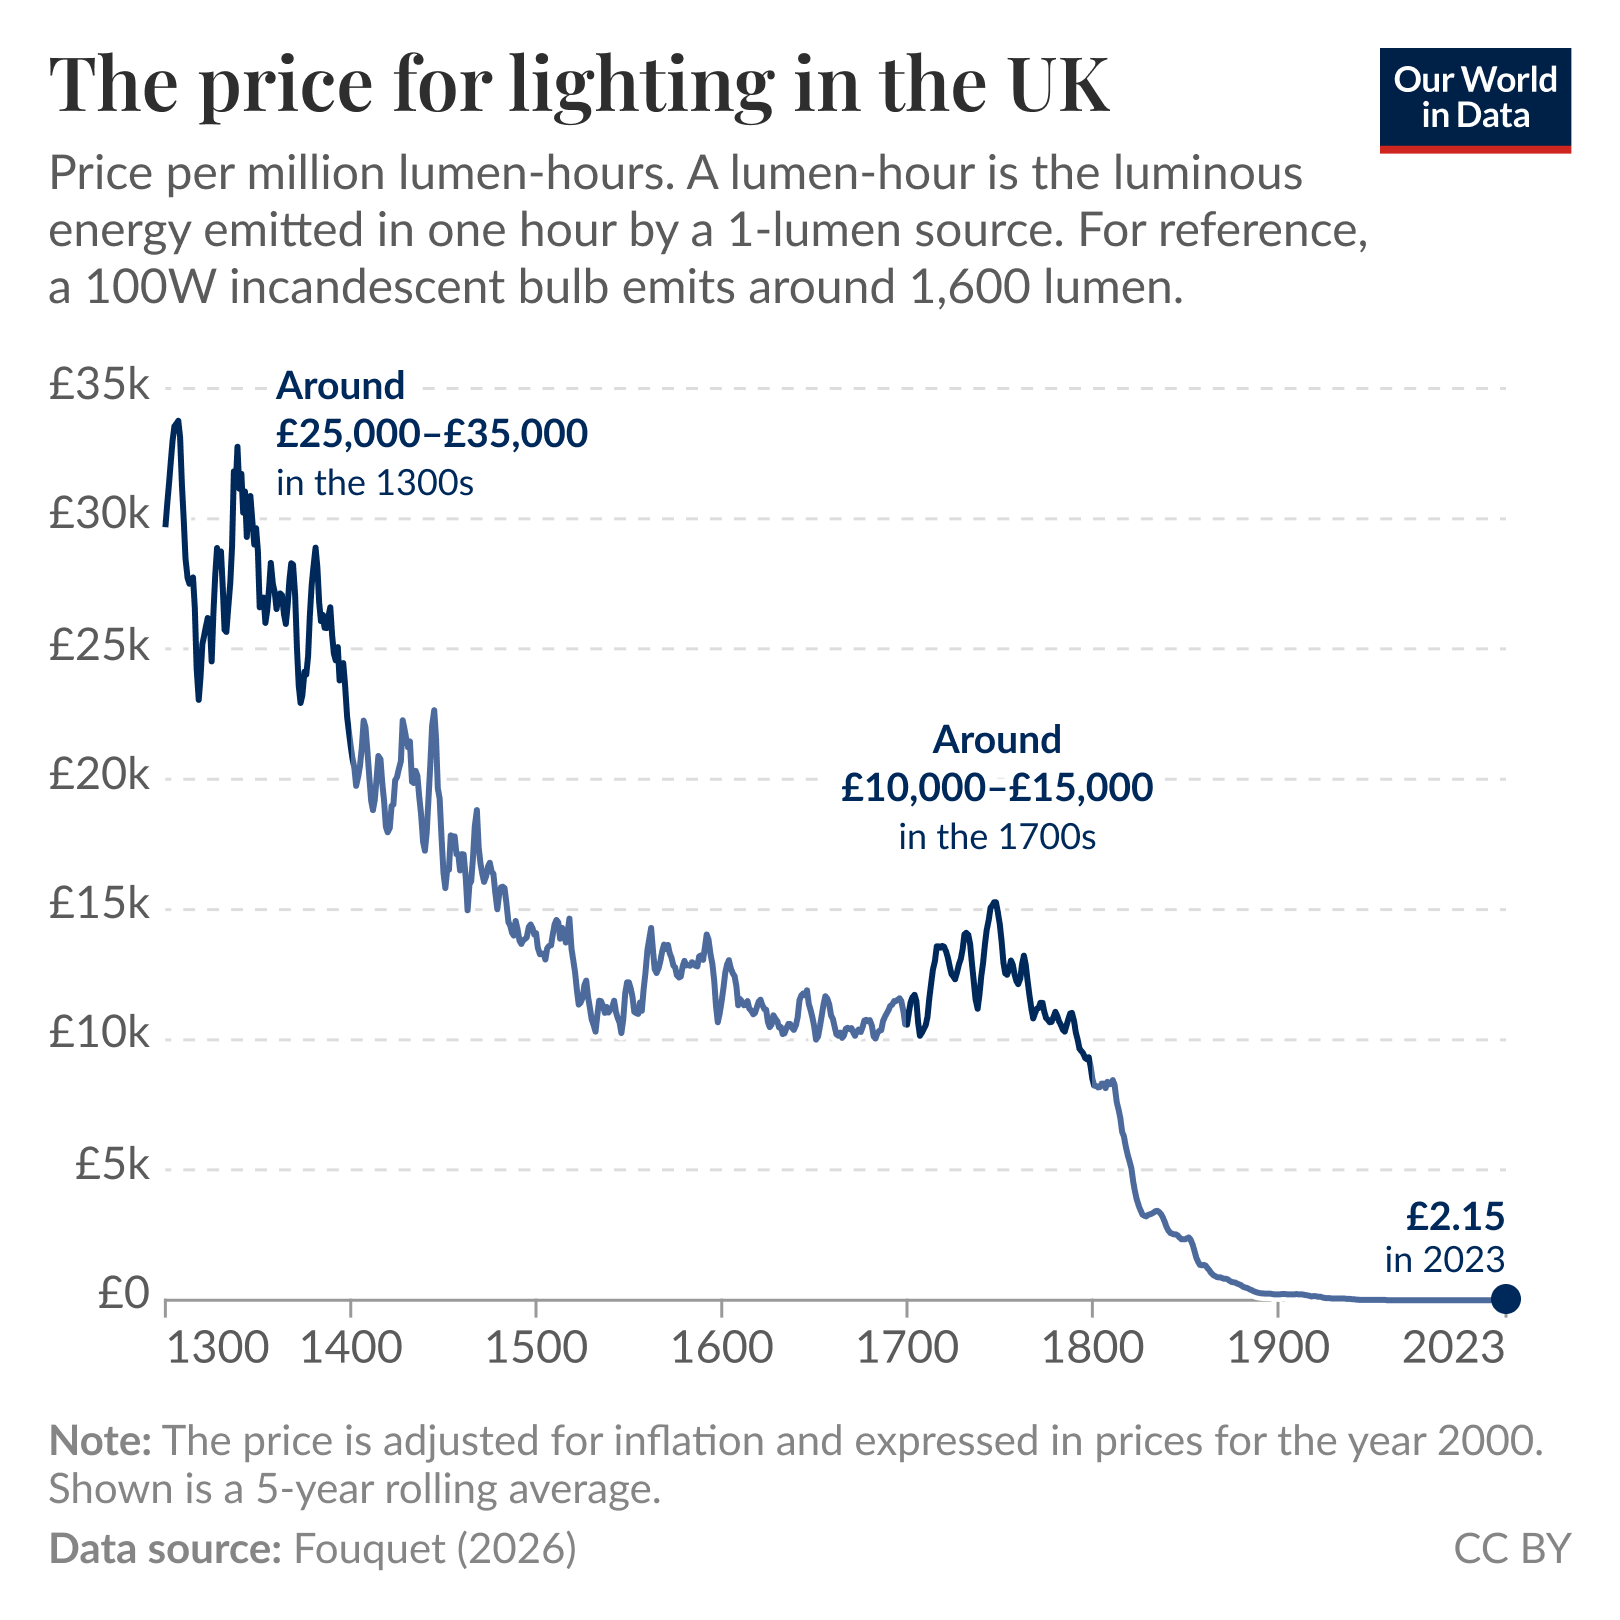 June 18 ### The price of lighting has dropped over 99\.9% since 1700 Esteban Ortiz\-Ospina and Pablo Arriagada In the last two centuries, the price of lighting has decreased drastically\. You can see this in the chart, which plots historical data fromRoger Fouquet\. To allow for comparisons over time, the data is adjusted for inflation and expressed in prices for the year 2000\. In the early 14th century, one million lumen\-hours — a standard lighting measure — would have cost around £34,000 in 2000 prices\. By 2023, this had fallen to £2\.15, a 16,000\-fold decline\. Innovations in lighting appliances, fuels, infrastructures, and institutions during the 19th and 20th centuries made this progress possible\. To put this in perspective, consider that a standard 100\-watt incandescent light bulb today can emit about 1,600 lumens\. Therefore, running one such bulb for 24 hours would produce about 40,000 lumen\-hours\. That means that 1 million lumen\-hours today would require continuously keeping a standard 100\-watt incandescent bulb on for about 26 days\. Achieving the same amount of light with candles would require 120 candles burning at once for that entire period\. Most people today take the ability to switch on a light at night for granted\. But those who live or have lived without artificial light can appreciate how important it is\. Discover more writing and data on our page on light at night](https://ourworldindata.org/data-insights/the-price-of-lighting-has-dropped-over-999-since-1700)
- [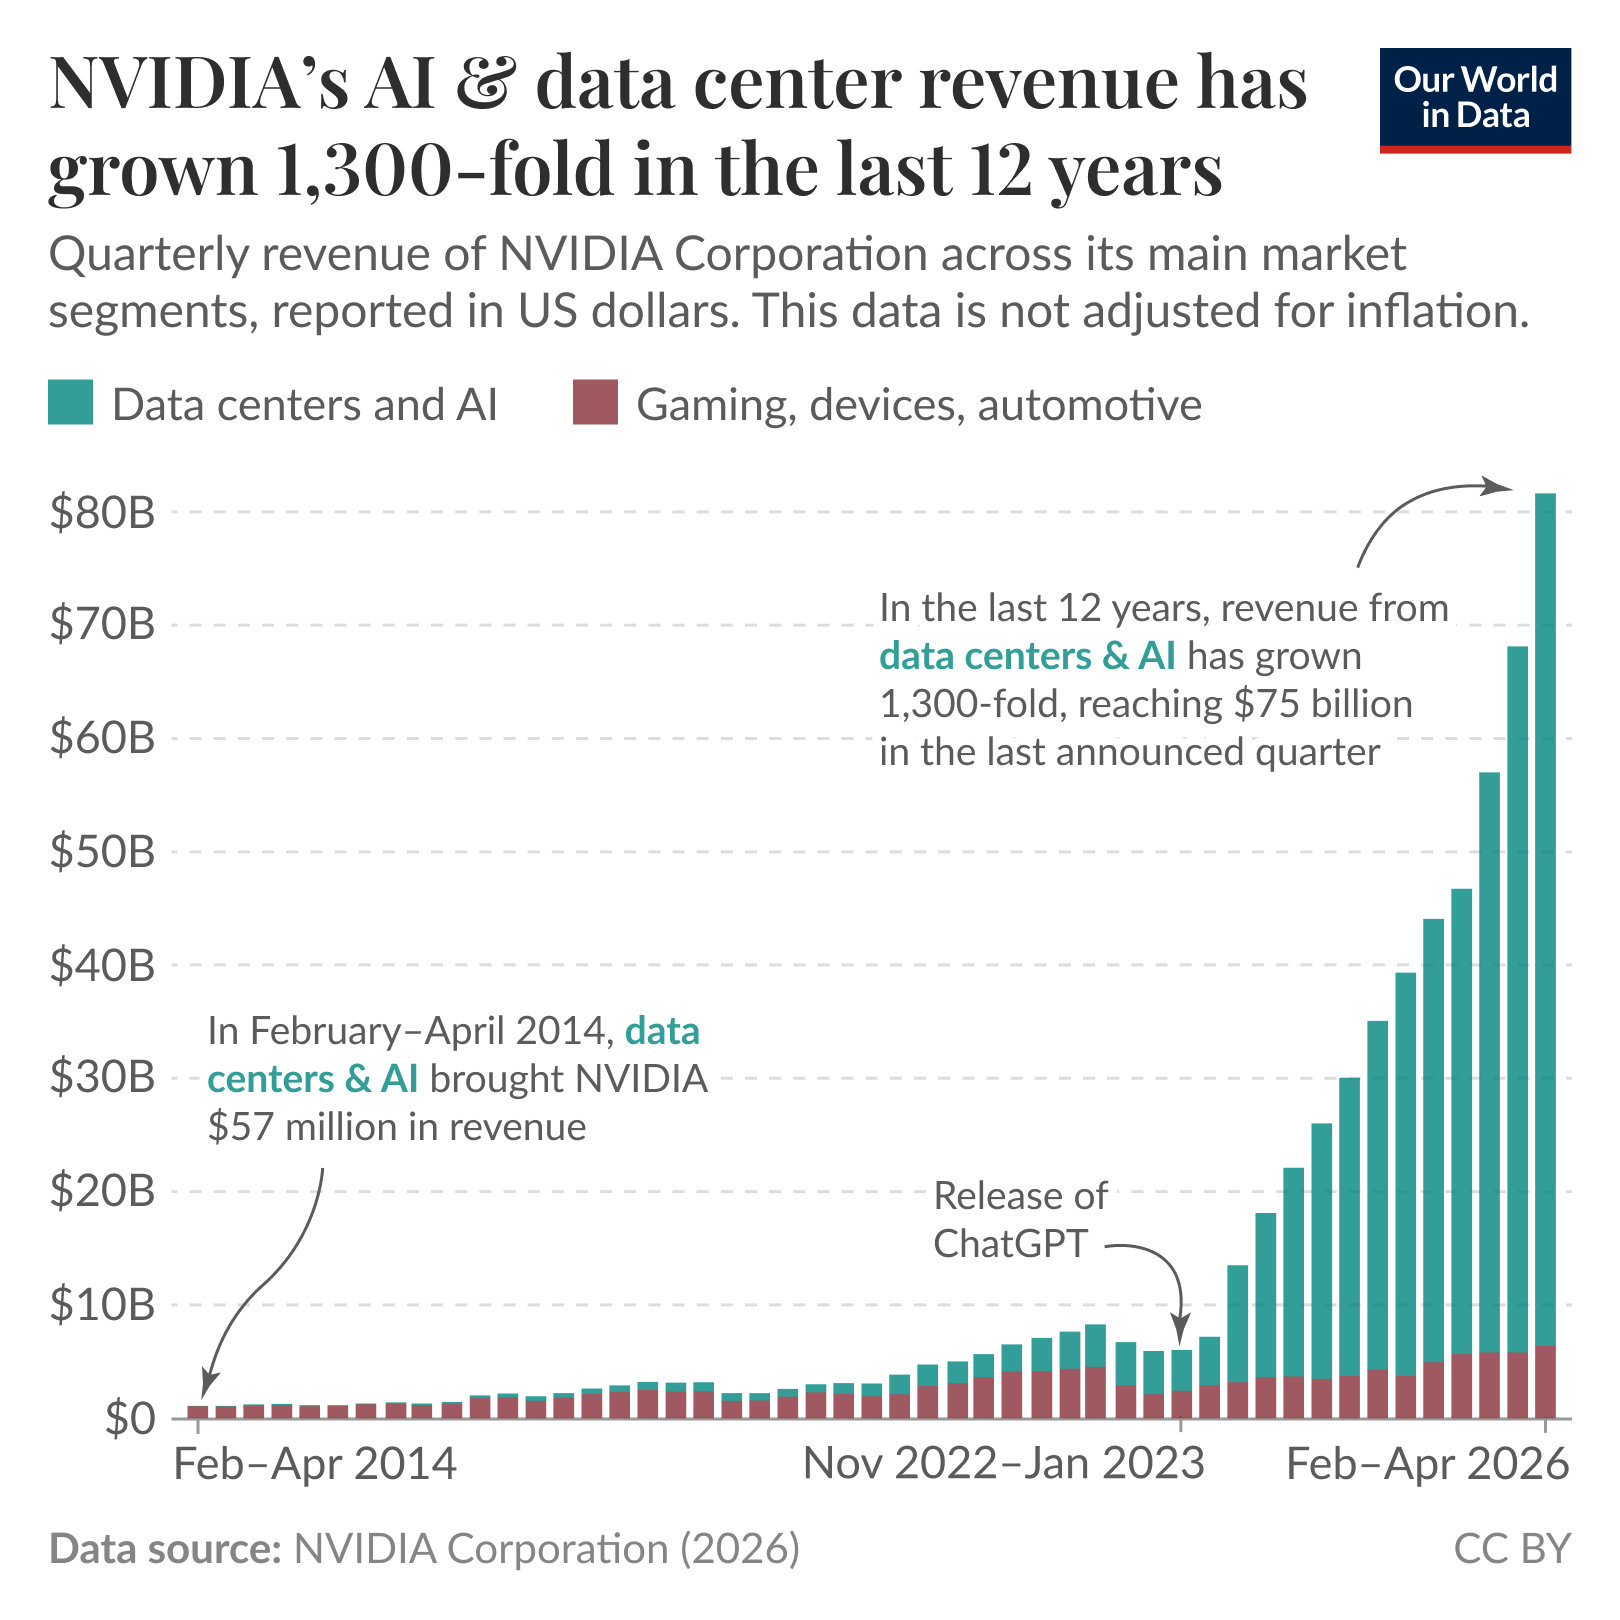 June 16 ### NVIDIA’s revenue from data centers and AI has grown 1,300\-fold in the last 12 years Edouard Mathieu and Veronika Samborska Spending on the hardware that trains and runs artificial intelligence has grown rapidly over the past years\. One of the clearest indicators of how rapidly spending has increased is the revenue of American chipmaker NVIDIA\. The company accounts for around85% of the global market for AI chips\. These are graphics processing units \(GPUs\), originally built for video games but well\-suited to the parallel computation AI training requires\. The chart shows NVIDIA's quarterly revenue in US dollars, split by end market — sales to data\-center customers \(cloud providers and AI companies\) in green, and sales for gaming, consumer devices, and cars in red\. In early 2014, data centers and AI accounted for just 5% of its revenue; gaming was the biggest single segment\. Twelve years later, the ratio has flipped: data centers and AI now make up over 90% of revenue\. The revenue in this segment has grown 1,300\-fold over the period, from $57 million to more than $75 billion per quarter\. The data centers and AI segment was already growing fast between 2014 and 2022, with revenue doubling every 16 months on average\. ChatGPT's release in late 2022, alongside the broader push to deploy AI at scale, has accelerated that pace: since then, revenue has doubled every 11 months\. Read our article on how increasing compute, data, and model size has made artificial intelligence more capable](https://ourworldindata.org/data-insights/nvidias-revenue-from-data-centers-and-ai-has-grown-1300-fold-in-the-last-12-years)