@realchendahuang: 咱就是说,要相信生态的力量,DSH走插件化的路线是对的。 不然你上哪里看到这么牛逼的上下文洞察? https://github.com/bowenliang123/dsh-context…
摘要
dsh-context 是一款 DeepSeek Harness 插件,为 Agent 提供完整的上下文生命周期管理,包括上下文洞察页面、Context/Fleet 仪表盘和 /context 命令,助力跨会话的用量、成本与上下文构成可视化。
查看缓存全文
缓存时间: 2026/10/21 07:22
咱就是说,要相信生态的力量,DSH走插件化的路线是对的。
不然你上哪里看到这么牛逼的上下文洞察?
https://t.co/joOHLFlX1K https://t.co/NXHMSqJXhw
bowenliang123/dsh-context
Source: https://github.com/bowenliang123/dsh-context
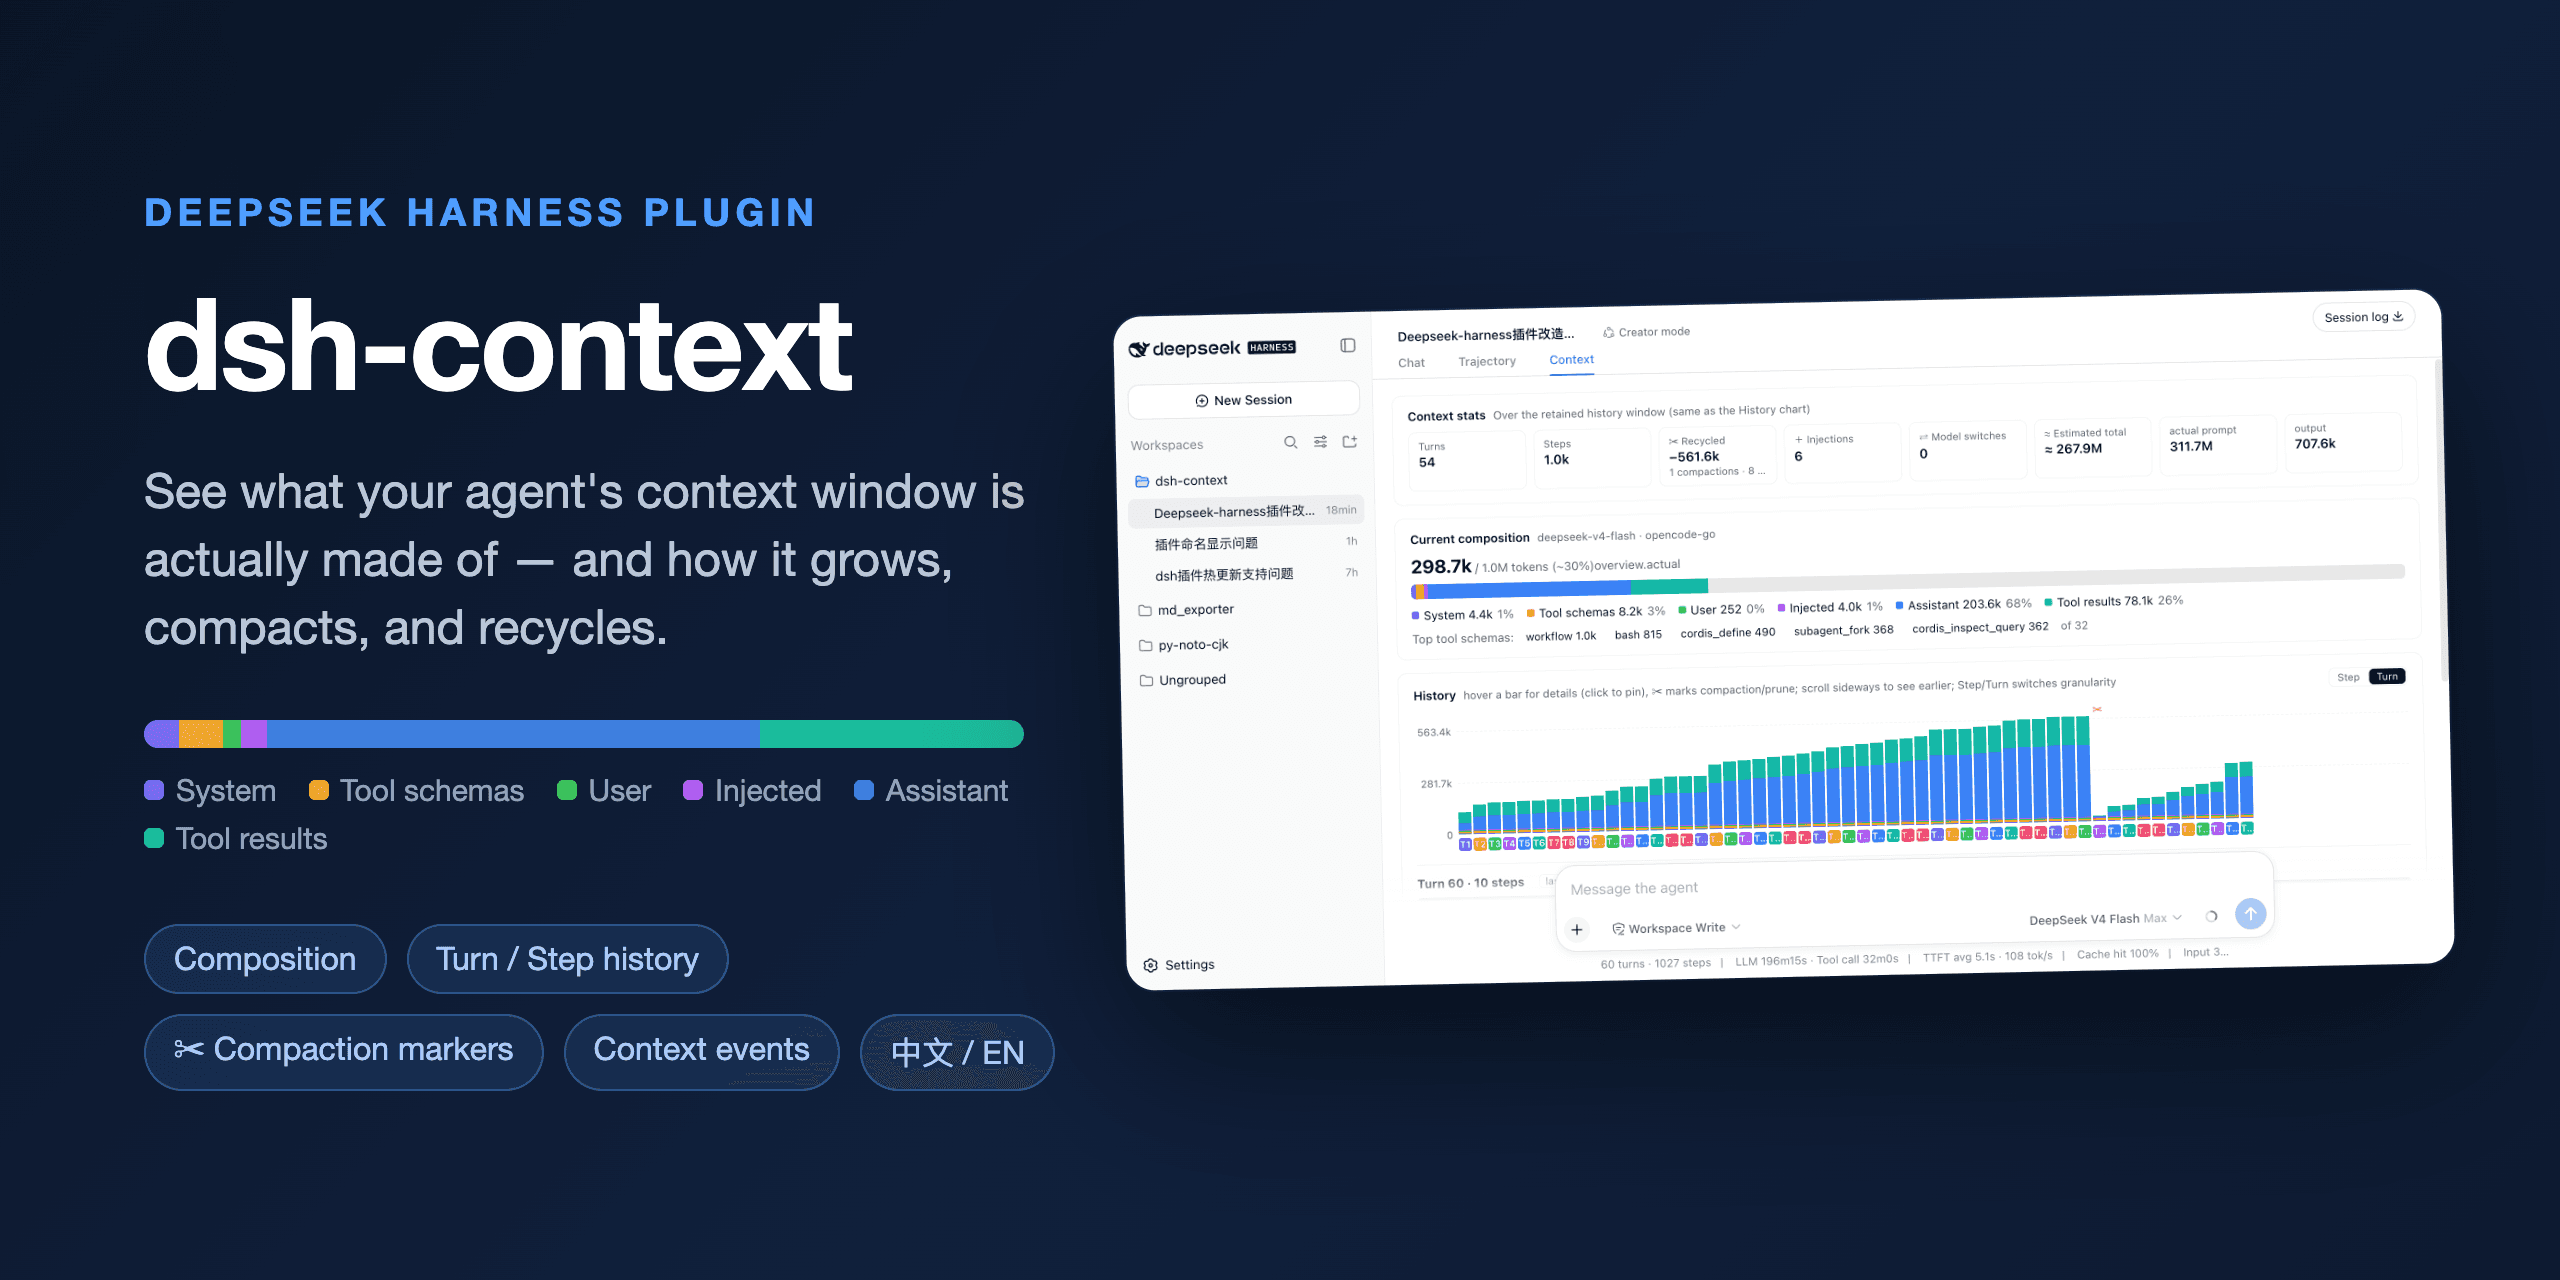
dsh-context


The best DeepSeek Harness plugin for Agent’s context insights and management.
Recommended and starred by DeepSeek Harness staff @tianyicui and @turtle1999 — see this post on X.
dsh-context provides full context lifecycle management features.
- Context Insights page — the cross-session overview as a first-level sidebar panel (beside Plugins and Automation tasks): KPI band with a 7-day token/cost usage chart, activity heatmap, aggregate composition ring, and filterable session cards that jump straight into any session.
- Context tab — an UI context dashboard for DeepSeek Harness’s context stats, composition, trend, events, and messages.
- Fleet tab — the agent family’s own page: the current agent, its parents, and every subagent as one live card each.
- Context panel — the same dashboard as a right-sidebar tab: pick Context on the sidebar’s guide page and the panel opens beside the chat, agent network included.
/contextcommand — the slash command shows the context model for current context composition and recent context evolution.
Install / Update
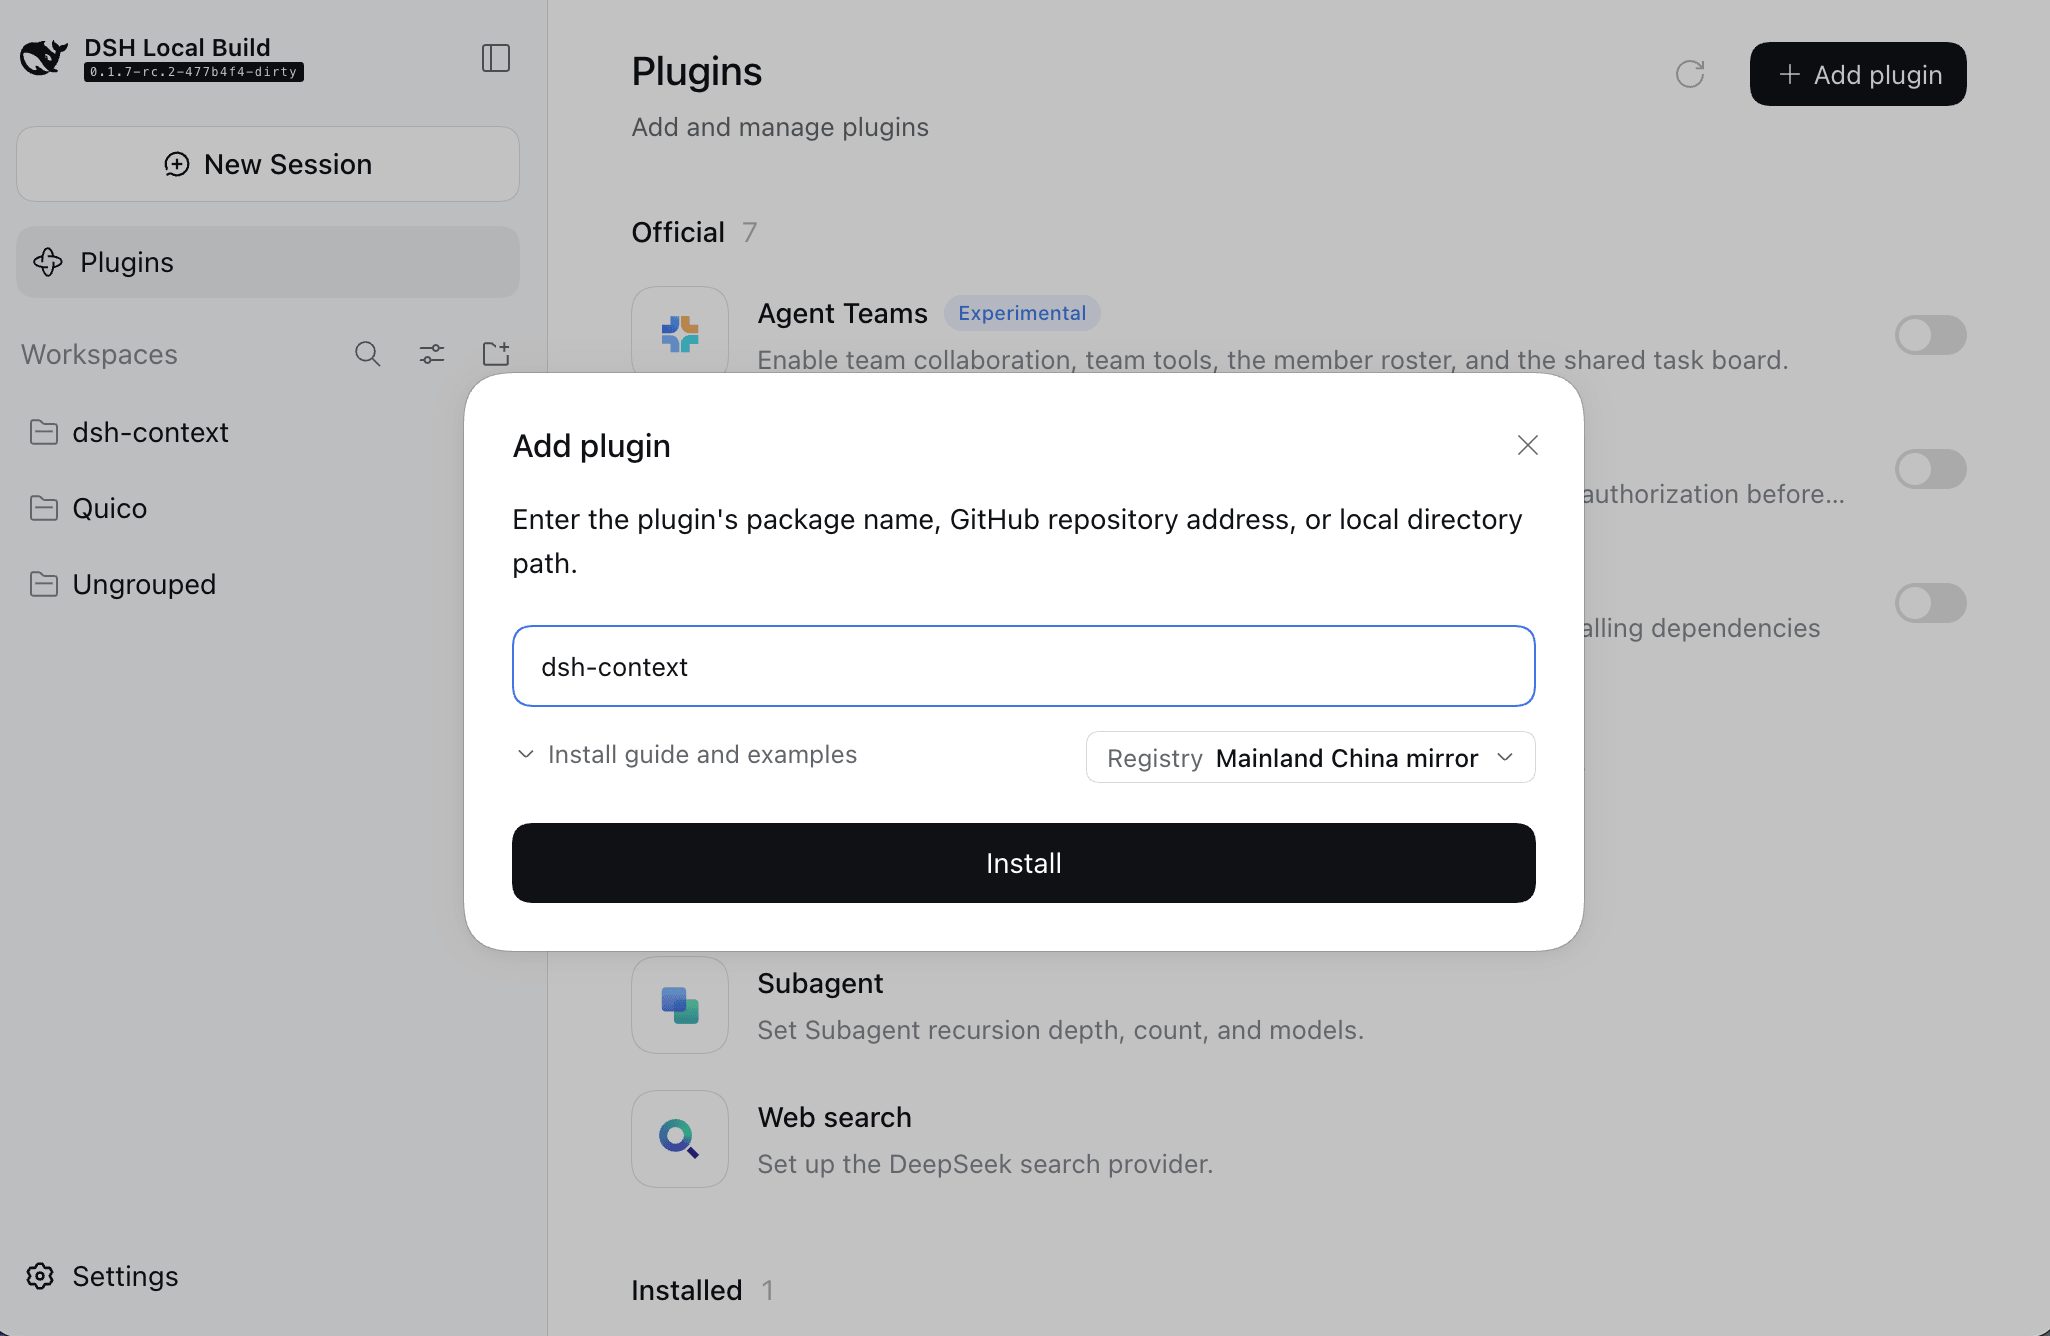
Install on DeekSeek Harness web or desktop
Fill dsh-context in the Add plugin wizard’s search box, and click Install:
Install with dsh cli
Install dsh-context plugin from DeepSeek Harness:
dsh plugin --profile web add dsh-context
Or update the dsh-context plugin:
dsh plugin --profile web update dsh-context@latest
Then start the web UI with dsh web. No build step, no restart.
Use it
Five surfaces, one story — what your agent is carrying, how it got there, and what it did with it:
| Where | What you get |
|---|---|
| Context Insights page | Every session at a glance: usage, cost, cache hit, daily activity, and per-session context profiles — filtered by range, day, group, or search, one click to jump in. |
| Context tab | The full dashboard: stats, composition, per-request trend, events, and file activity — in every session. |
| Fleet tab | The agent network: the current agent, its parents, and every subagent, live. |
/context command | A centered modal with the same composition and context browser, without leaving the chat. |
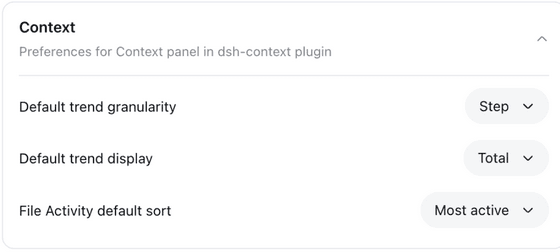
| Preferences card | Per-user defaults: view placement, trend granularity & mode, File Activity sort, and the system prompt prefix/suffix joined around every session. |
🗂️ The Context Insights page
Click Context Insights / 上下文洞察 in the sidebar’s panel list — the same row level as Plugins and Automation tasks — and the page opens as a full center-column panel:
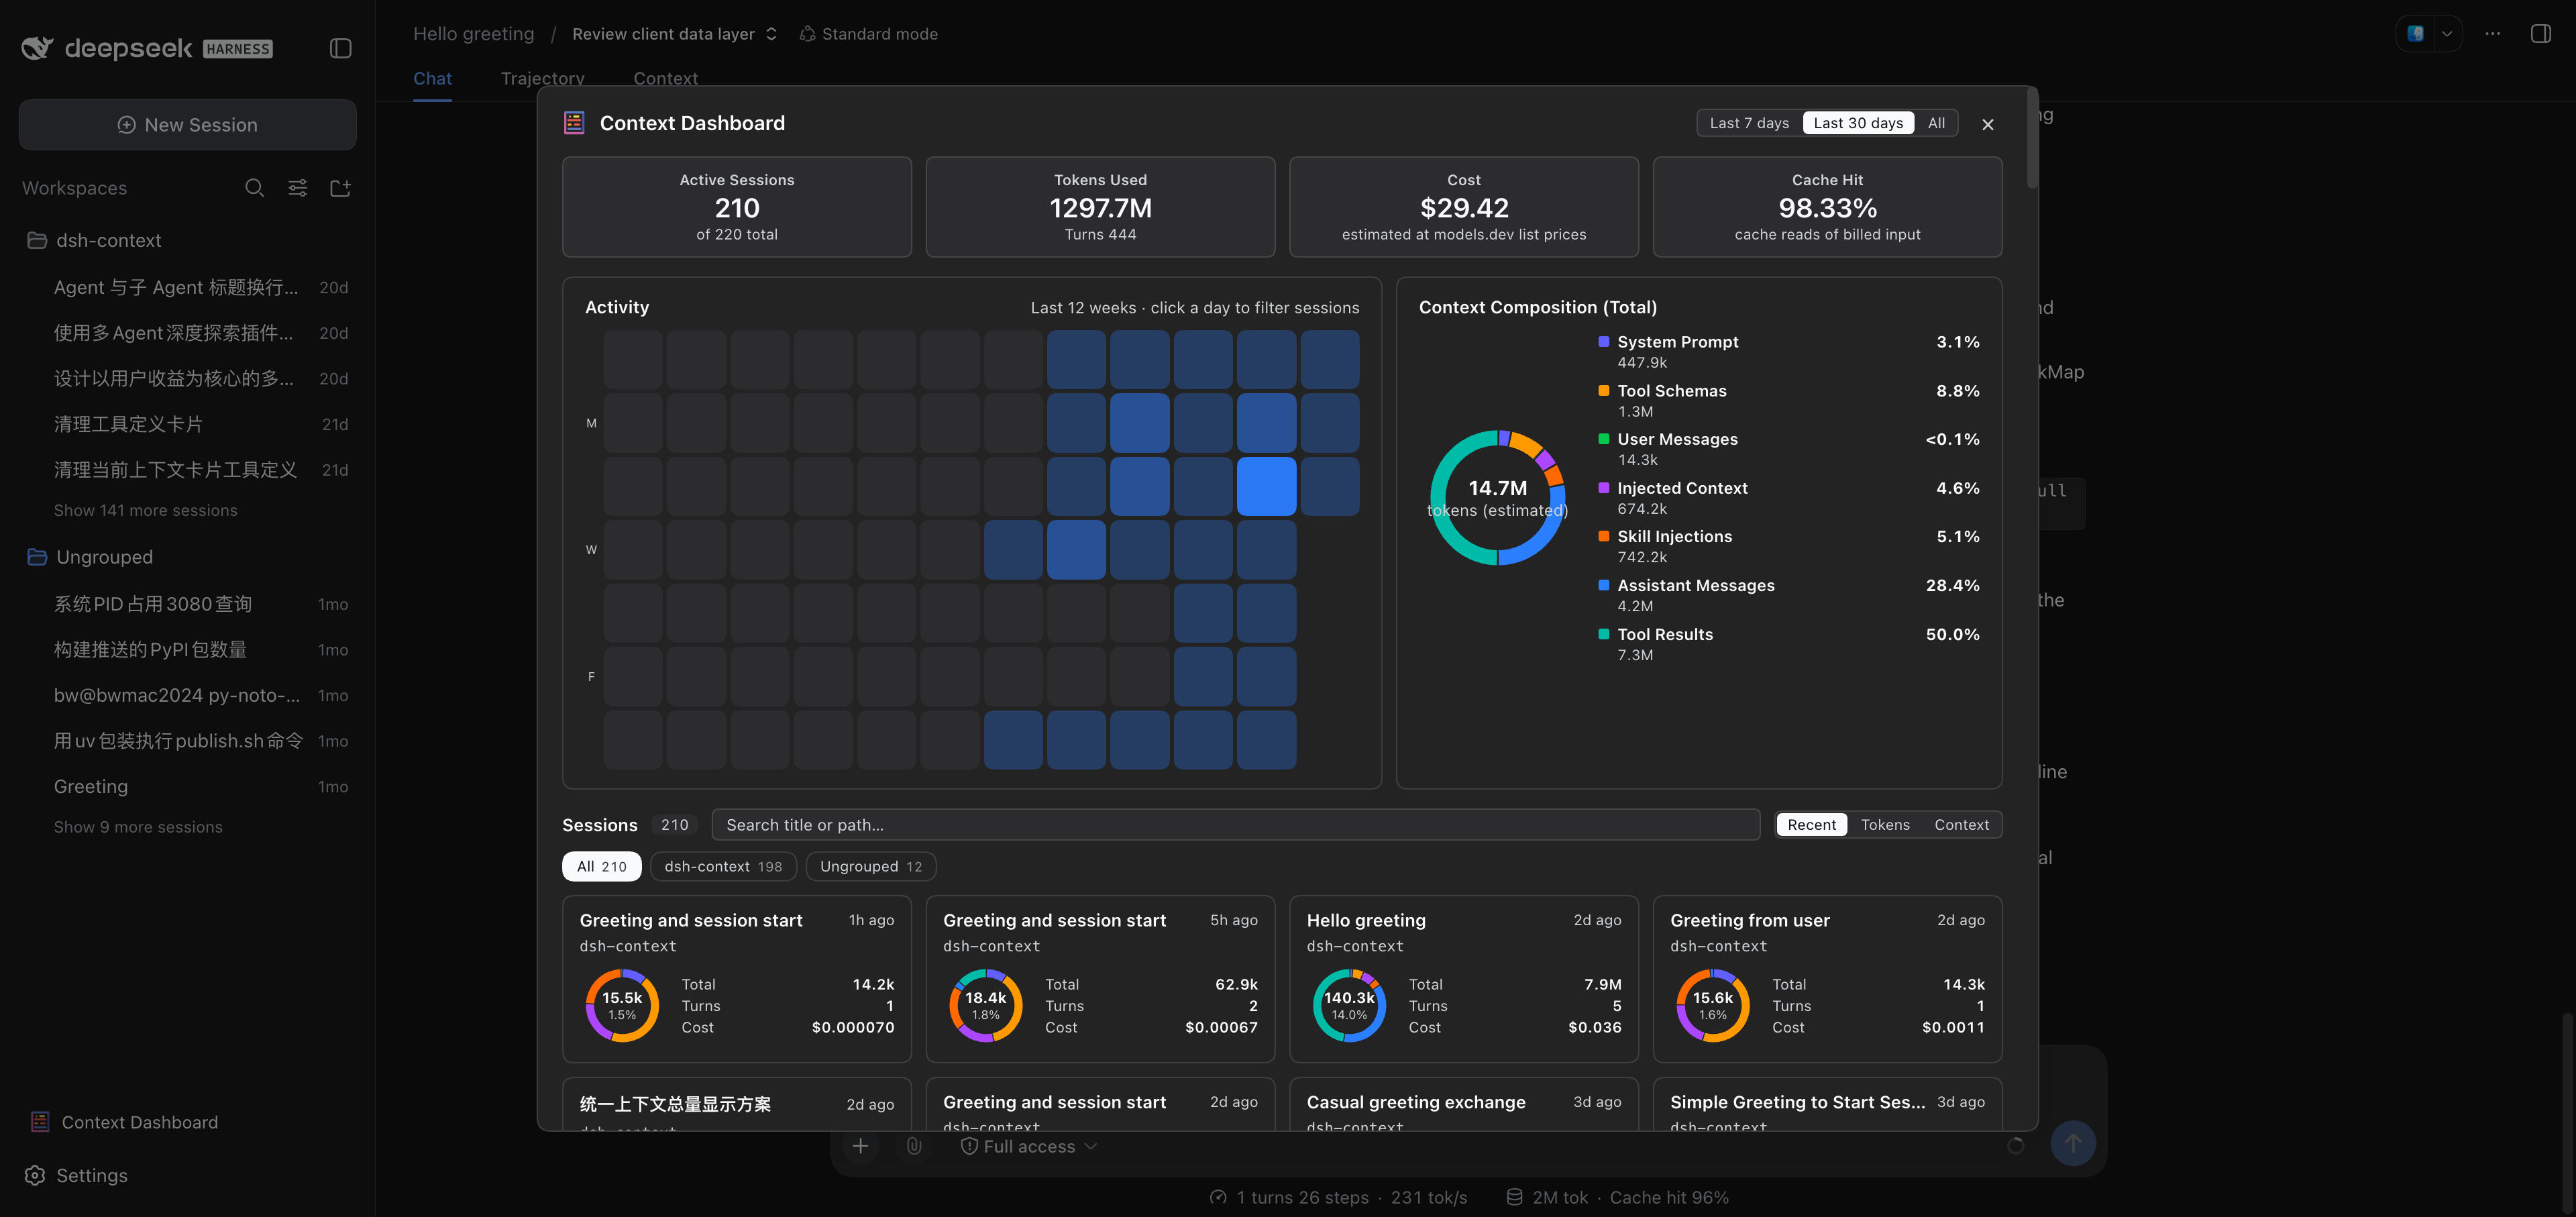
| Section | The question it answers |
|---|---|
| KPI band | How much am I using — sessions, billed tokens, estimated cost, cache-hit rate, turns, tool runs, and active time over the picked range (7d / 30d / all), each figure folded by the day its step started. |
| 7-day usage chart | When did I spend what — each of the last 7 days’ billed tokens and estimated cost as a bar pair, folded per turn off the sessions’ own request times (not the session’s last-active day). |
| Activity heatmap | When do I actually work — the last 8 weeks of daily billed tokens; click a day to filter the sessions that were active on it. |
| Settings entry | One row under the heatmap — the same guarded jump to this plugin’s preferences as the Context tab’s Plugin Info card. |
| Context Composition | Where the picked range’s billed tokens went, split by the Context tab’s composition categories. |
| Session cards | Each session’s profile: composition ring, billed tokens, turns, cost, and its workspace-group / project breadcrumb — sorted by recency, tokens, or context size, searchable, grouped by workspace. A card click opens the session. |
📊 The Context tab
Open any session and click the Context / 上下文 tab:
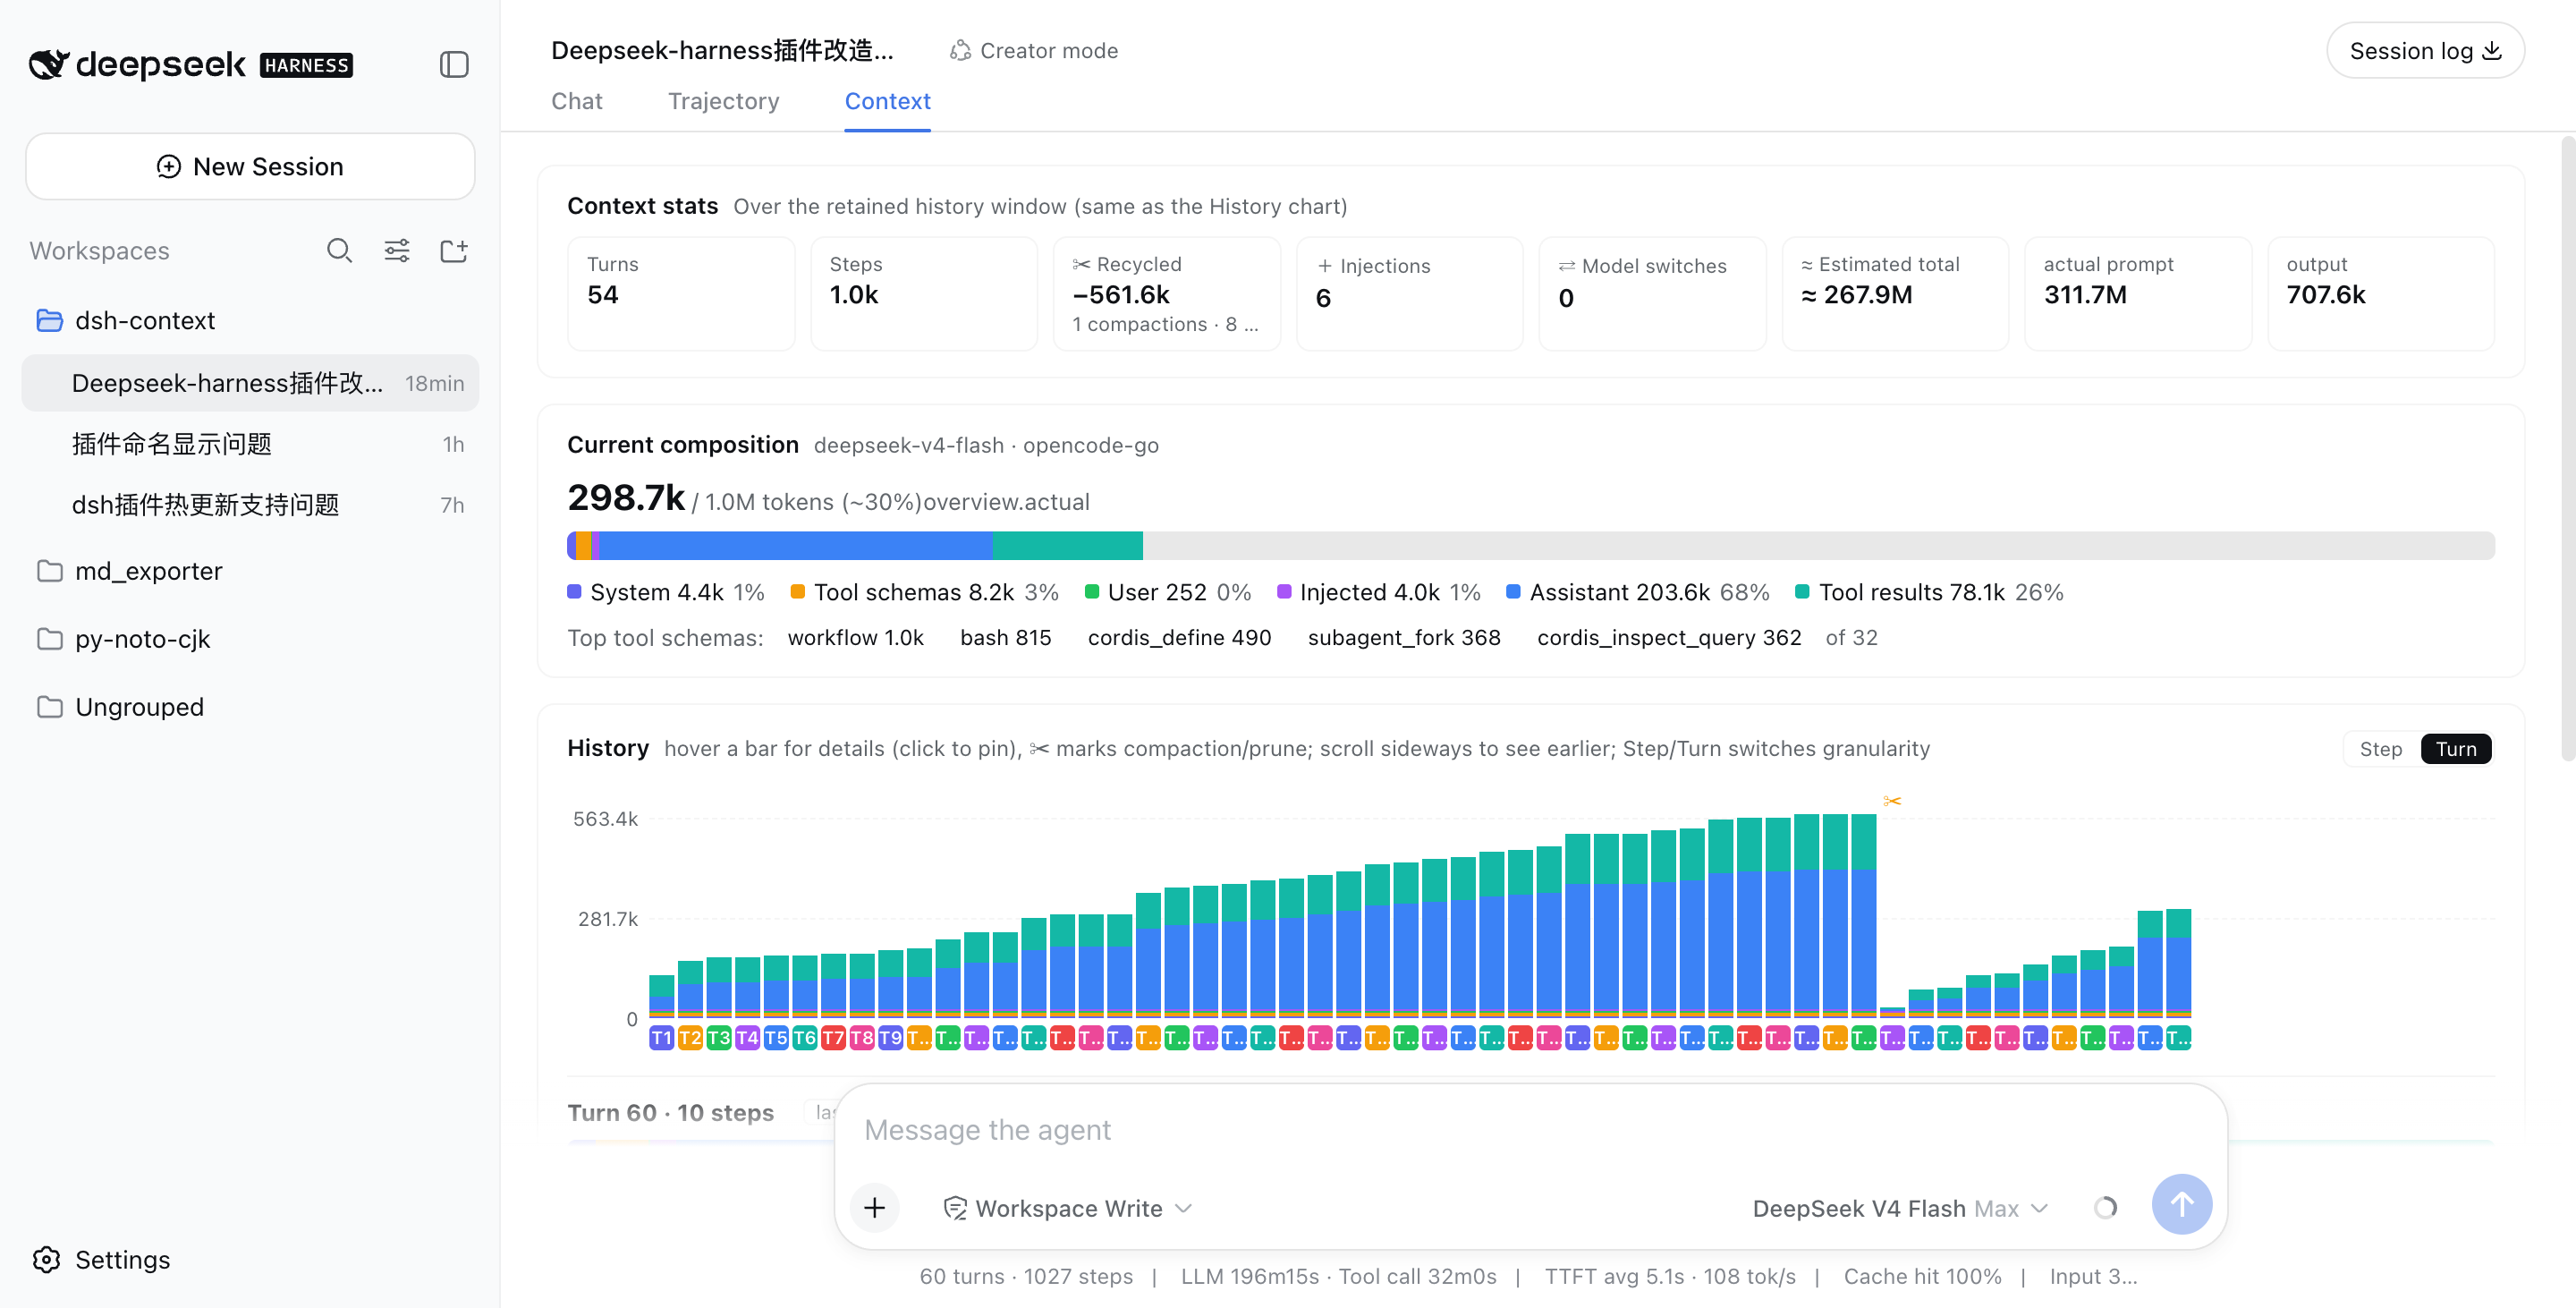
| Card | The question it answers |
|---|---|
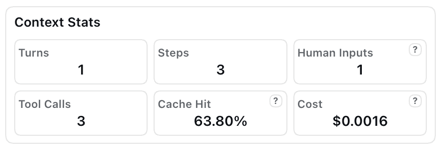
| Context Stats | Turns, steps, human inputs, live tool calls — plus a cost estimated from the models.dev list prices (hover the ? for per-1M rates; only DeepSeek splits peak/off-peak: its listed rates are the off-peak tier, and peak windows bill at 2×). |
| Token Stats | Where the billed tokens went — the same total as the chat stats line under the composer, split by composition (system, tools, messages…) with the provider-exact output closing the ring, and the session’s cache-hit rate in the corner. |
| Timing Stats | How active time split across model calls, tool runs, and overhead. |
| Current Context | What’s in the window right now. |
| Context Trend | Every request’s size — and its story. |
| Context Browser | What any request was actually assembled from. |
| Context Events | When and why the window changed. |
| File Activity | What the agent did to your files. |
The headline occupancy and composition read the same official token-meter projections as the chat composer’s context ring (contextPressure / contextBreakdown), so the figures always match what the ring tells you — the card’s percentage is that same occupancy, printed with one decimal.
The Context Stats card’s Agent Network cell (the billed tokens and estimated cost of the whole family) jumps to the Fleet tab. Its Input / Output pills are jump links too: Human Inputs opens the Context Browser on your messages, and Read / Written / Searched / Images land on the File Activity card with that kind picked.
Context Stats
Token Stats and Timing Stats

Context Stats
🧱 Current Context — what’s in the context window now

A six-color stacked bar against the model’s full window (the two hatched masks at the end = auto-compaction’s reserve: its headroom, then the request’s reserved output window): system prompt, tool schemas, user messages, injected context, assistant replies, tool results — each with its ≈token figure and share. When a conversation starts degrading, this is where you see which part is responsible.
📈 Context Trend — how the context grew and evolved by turn or steps
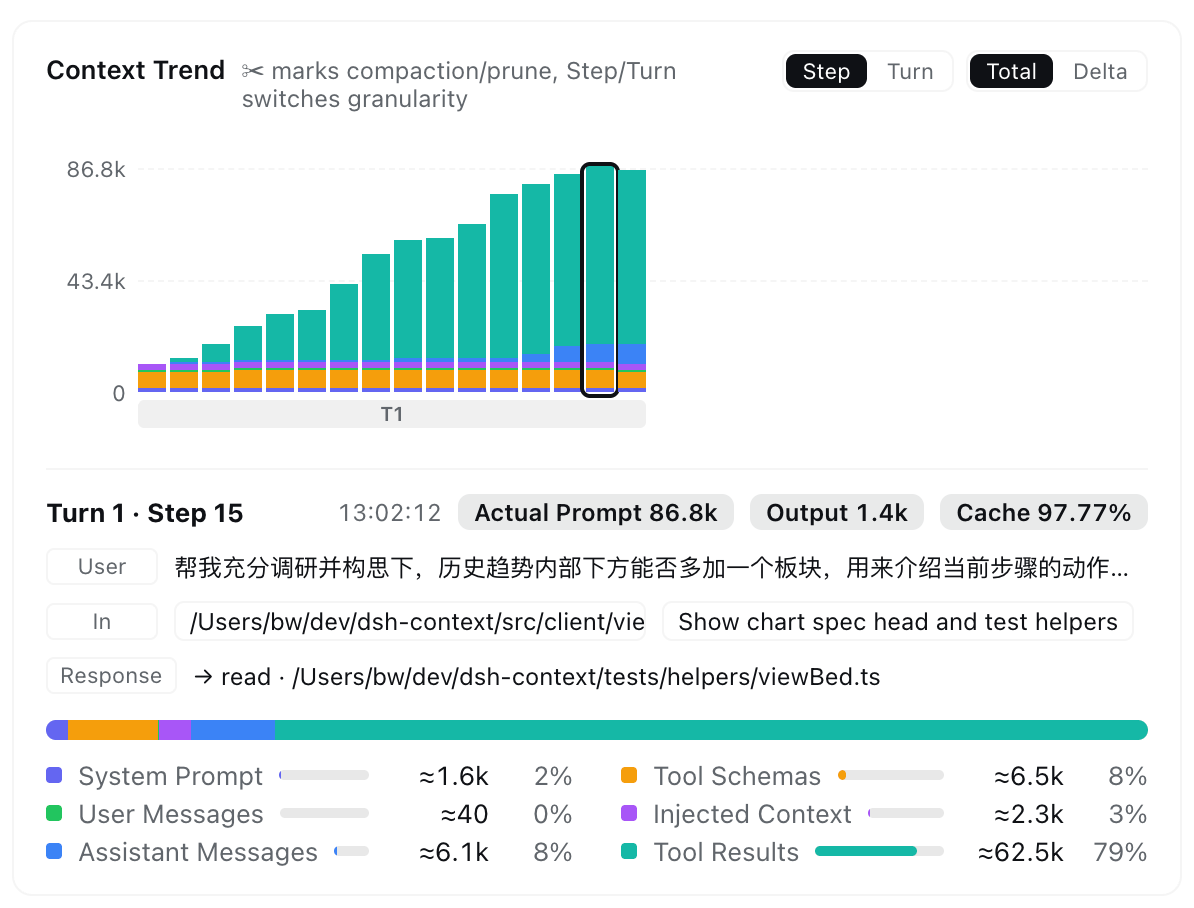
One stacked bar per model request — finer than per-message — so you watch the window grow turn by turn:
- ✨ Step brief — three plain-language rows under the chart: User recalls the message that opened the turn, In lists what newly entered (usually the previous tool results), Response shows the reply and/or tools called. Click a row to open that exact message in the Context browser.
- ✂ marks the events — compactions and prunes are pinned to the bar where they happened, so the drops explain themselves.
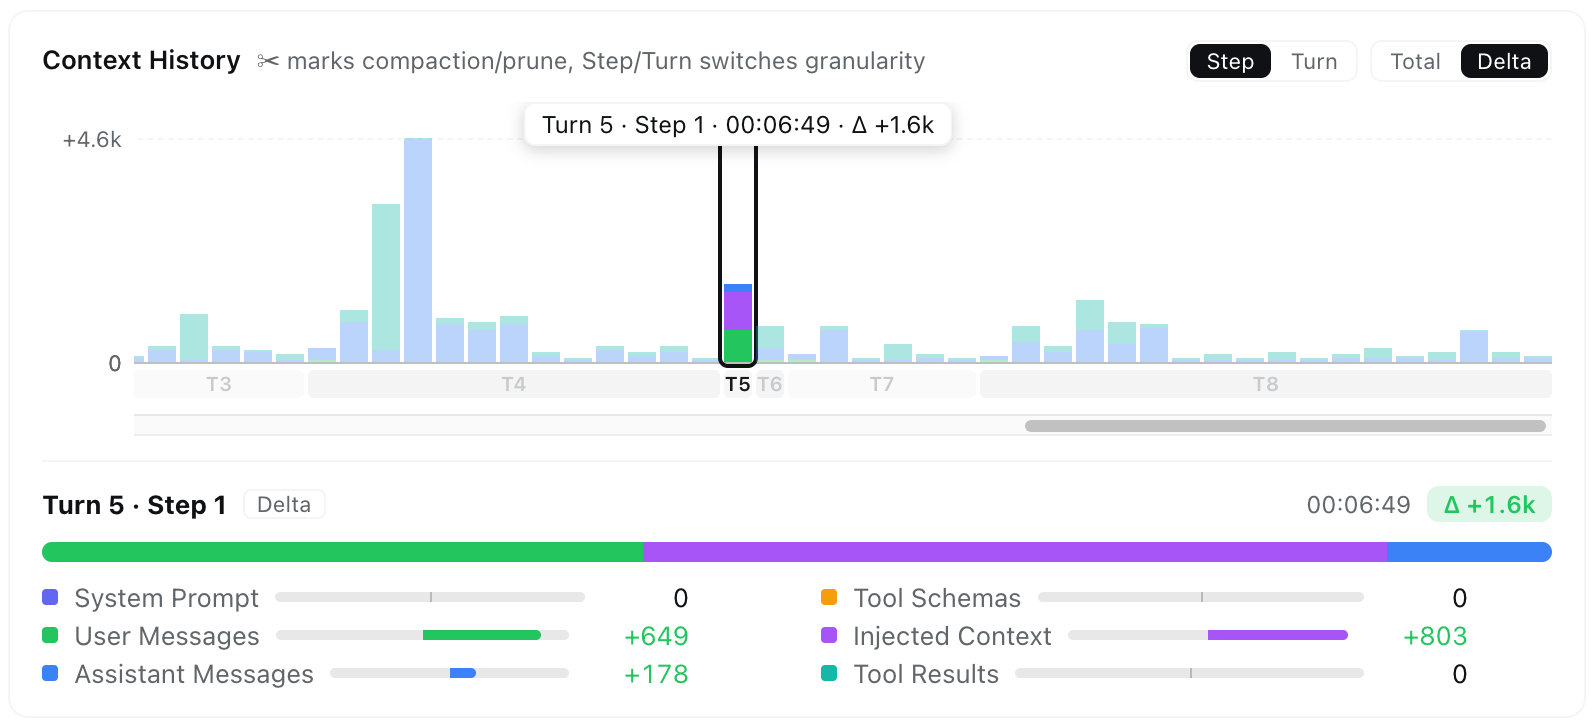
- Read it your way — Step / Turn granularity, Total (cumulative makeup) or Delta (each request’s signed change), and sideways scrolling through the whole session. In Delta mode, growth piles up above the baseline and a compaction dives below it:
- Overview — one toggle squashes the whole session (steps or turns) into the pane’s width as a continuous stacked ribbon: every compaction drop and composition shift at a glance, no sideways scrolling, nothing extra to load. Flags mark the quartiles and the full span; hover to scrub, hover a band to light that category across the whole ribbon; click pins the step and opens that band’s category in the browser (exclusive with DNA mode and Adaptive).
- Hover & pin — scrub for an instant tooltip; click to pin the full breakdown, with provider-reported Actual Prompt / Output / Cache next to the estimates.
- Live linkage — hovering a bar previews that step’s assembled context in the Context browser beside the chart; leaving the chart returns to your own pick.
🧭 Context Browser — open the box of any request
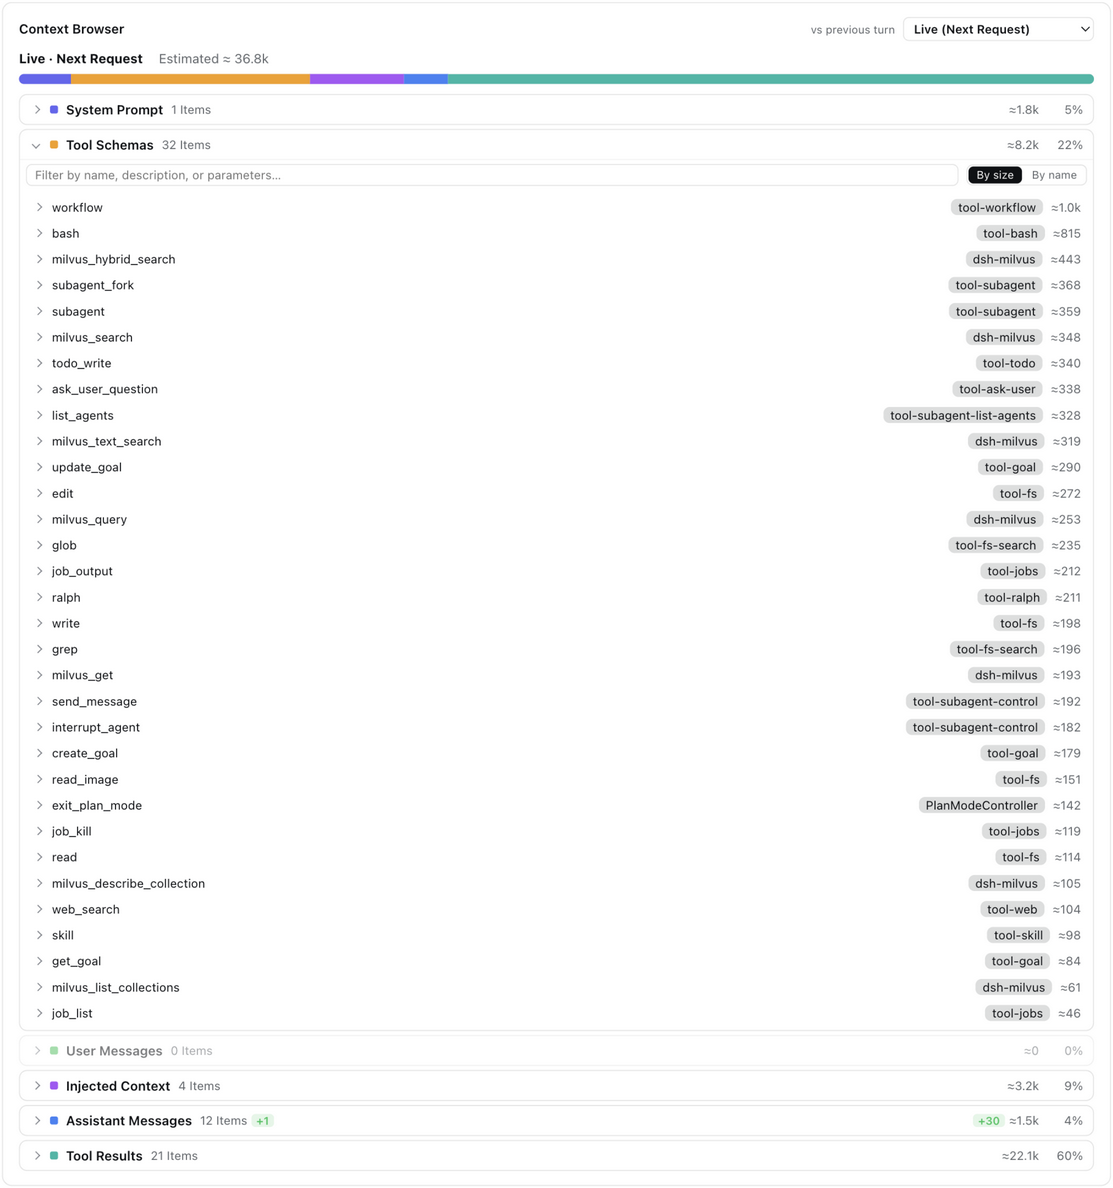
Pick Live (next request) or any retained step, and browse what that request was assembled from: seven collapsible categories expand into one row per element with its token price, and every element expands again into its actual content — the system prompt, each tool’s JSON schema, message text, reasoning, tool arguments, and tool outputs. Skill content (the available-skills catalog, /skill invocations, and skill-tool loads) has its own Skill Injections category, so a stealthy skill’s context footprint can’t hide inside the injected-context and tool-result buckets.
- Who provides each tool — every tool-schema row carries a best-effort source chip:
tool-*first-party packages,dsh-*capability packages,mcp:<server>proxies, or the exact plugin watched live fromtools.register(). Sort by size / name, and filter every category by its own searchable fields:
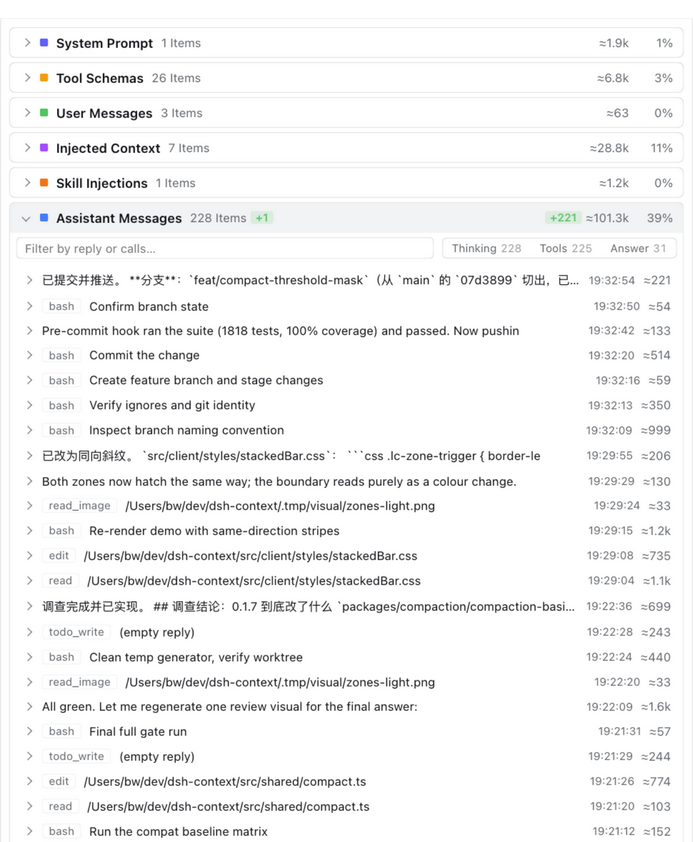
- Filter assistant replies by kind — the assistant category’s search box carries Thinking / Tools / Answer chips, each with the shown step’s message count (one reply can carry several); click one to keep only the matching replies, click again to clear:
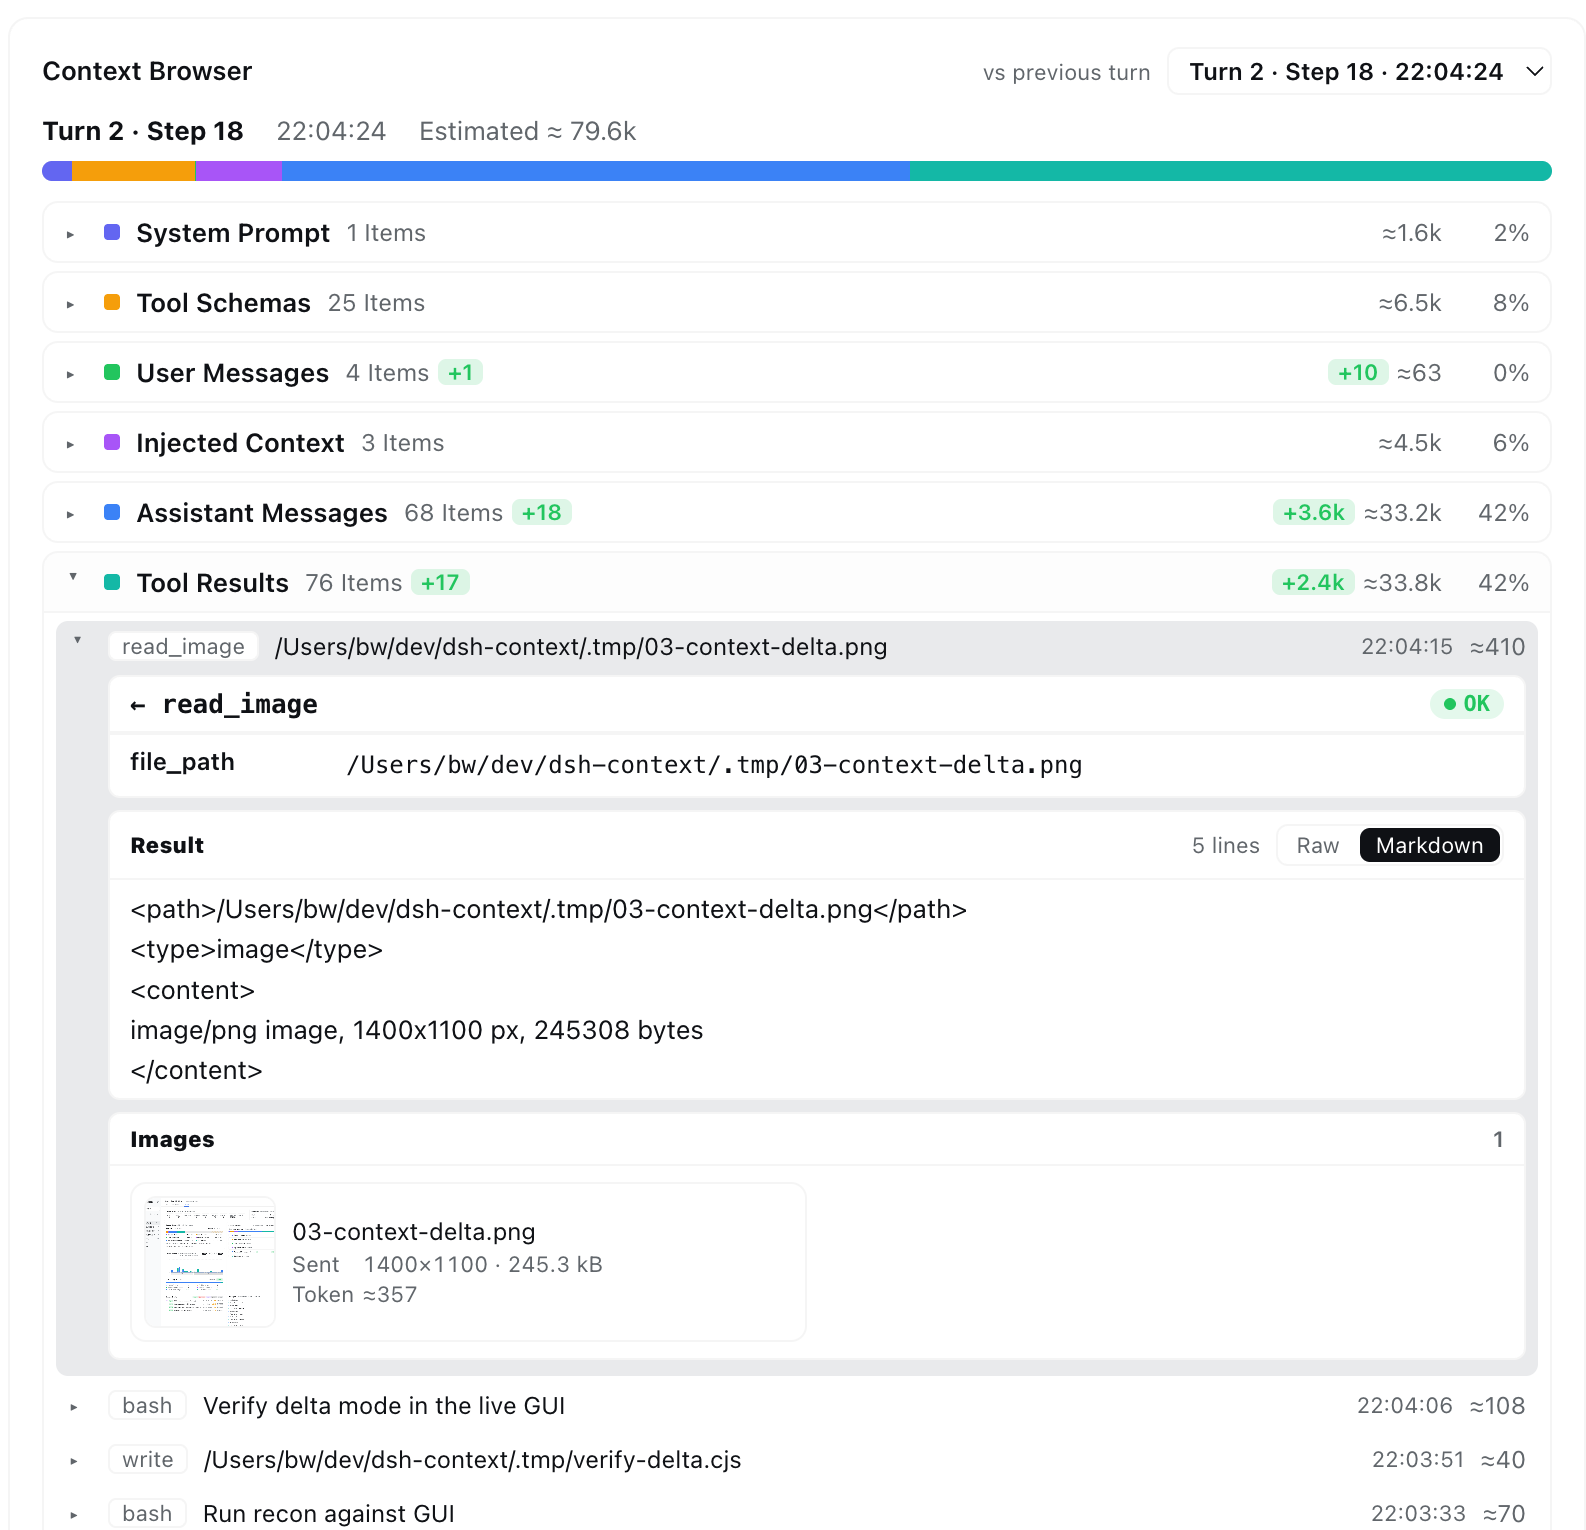
- Tool results open into the full call — the tool name and arguments with its OK/error status, the result body with line count and a Raw / Markdown toggle:
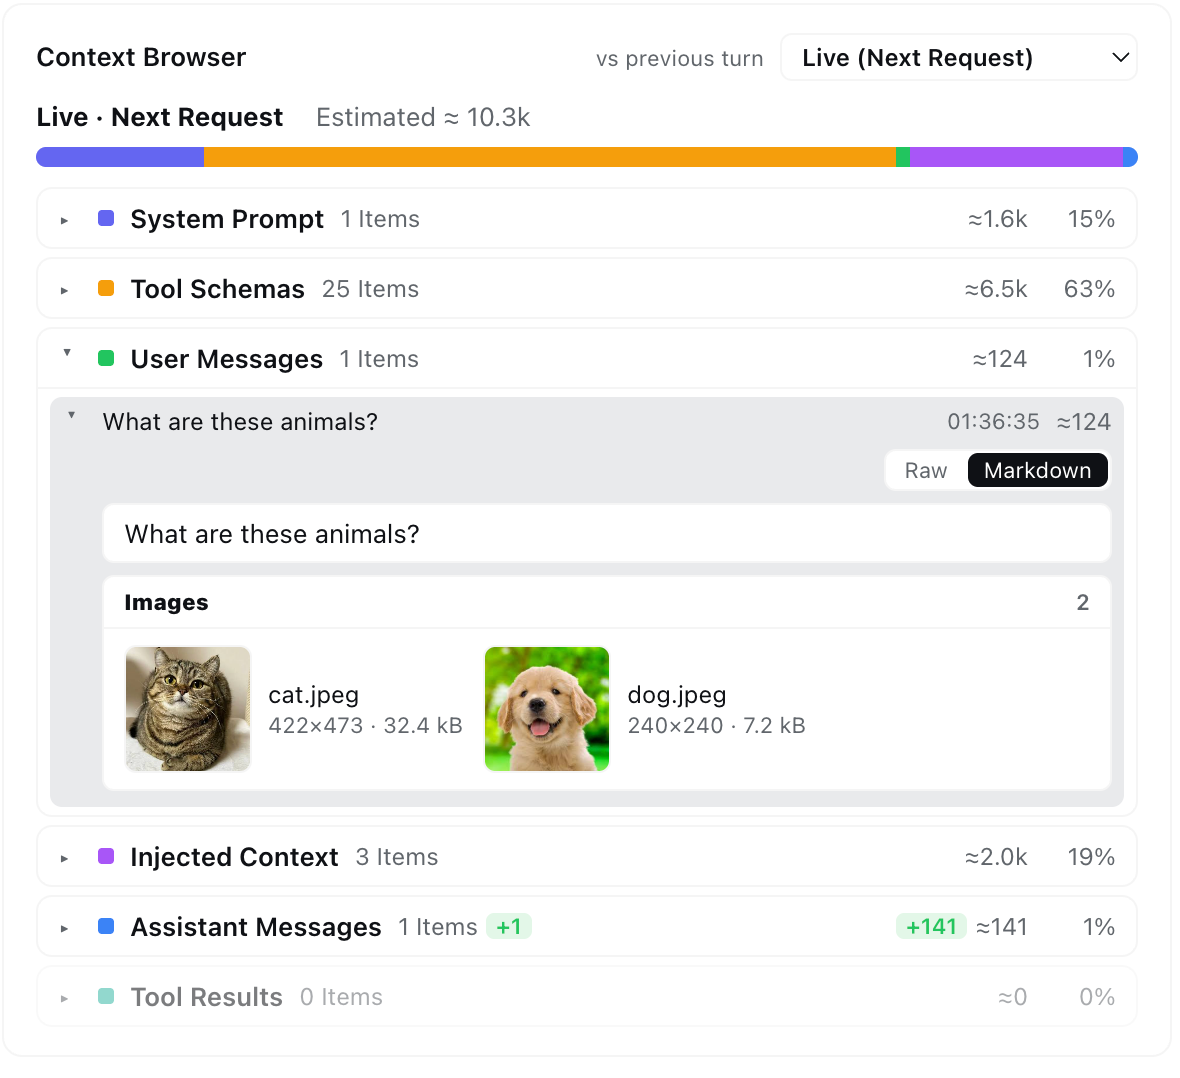
- Attachments render as ordered cards — a message’s
imageandfileblocks sit together in the order the message carries them, one card each: images with a thumbnail plus their dimensions, stored size, and the official DeepSeek image-token estimate; other files with their type glyph, extension, and stored size. One click opens the attachment in dsh’s own preview column (markdown, code, PDF, office, and image viewers), under the file’s real name:
-
Diff against the previous turn — signed delta badges per category (
+Nitems,±Nktokens) tell you what a turn added or reclaimed at one glance. Steps older than a compaction are reconstructed from the removed-message archive — and the card says so when a step’s makeup is only approximate. -
DNA mode lays the whole context out flat — the bar draws one band per item in the model’s reading order, and below it the same items become one flat list with the newest message on top (the model reads oldest-first, so the list runs that order bottom-up): every row carries its prompt position (
#12), category, introducing step, and token price, and expands into the same full content; the tool schemas and the system prompt close the list as two group rows. The card ends flush with the composition + trend cards beside it — a fully flattened session scrolls inside instead of flooding the page.
⚡ Context Events — when and why the window changed
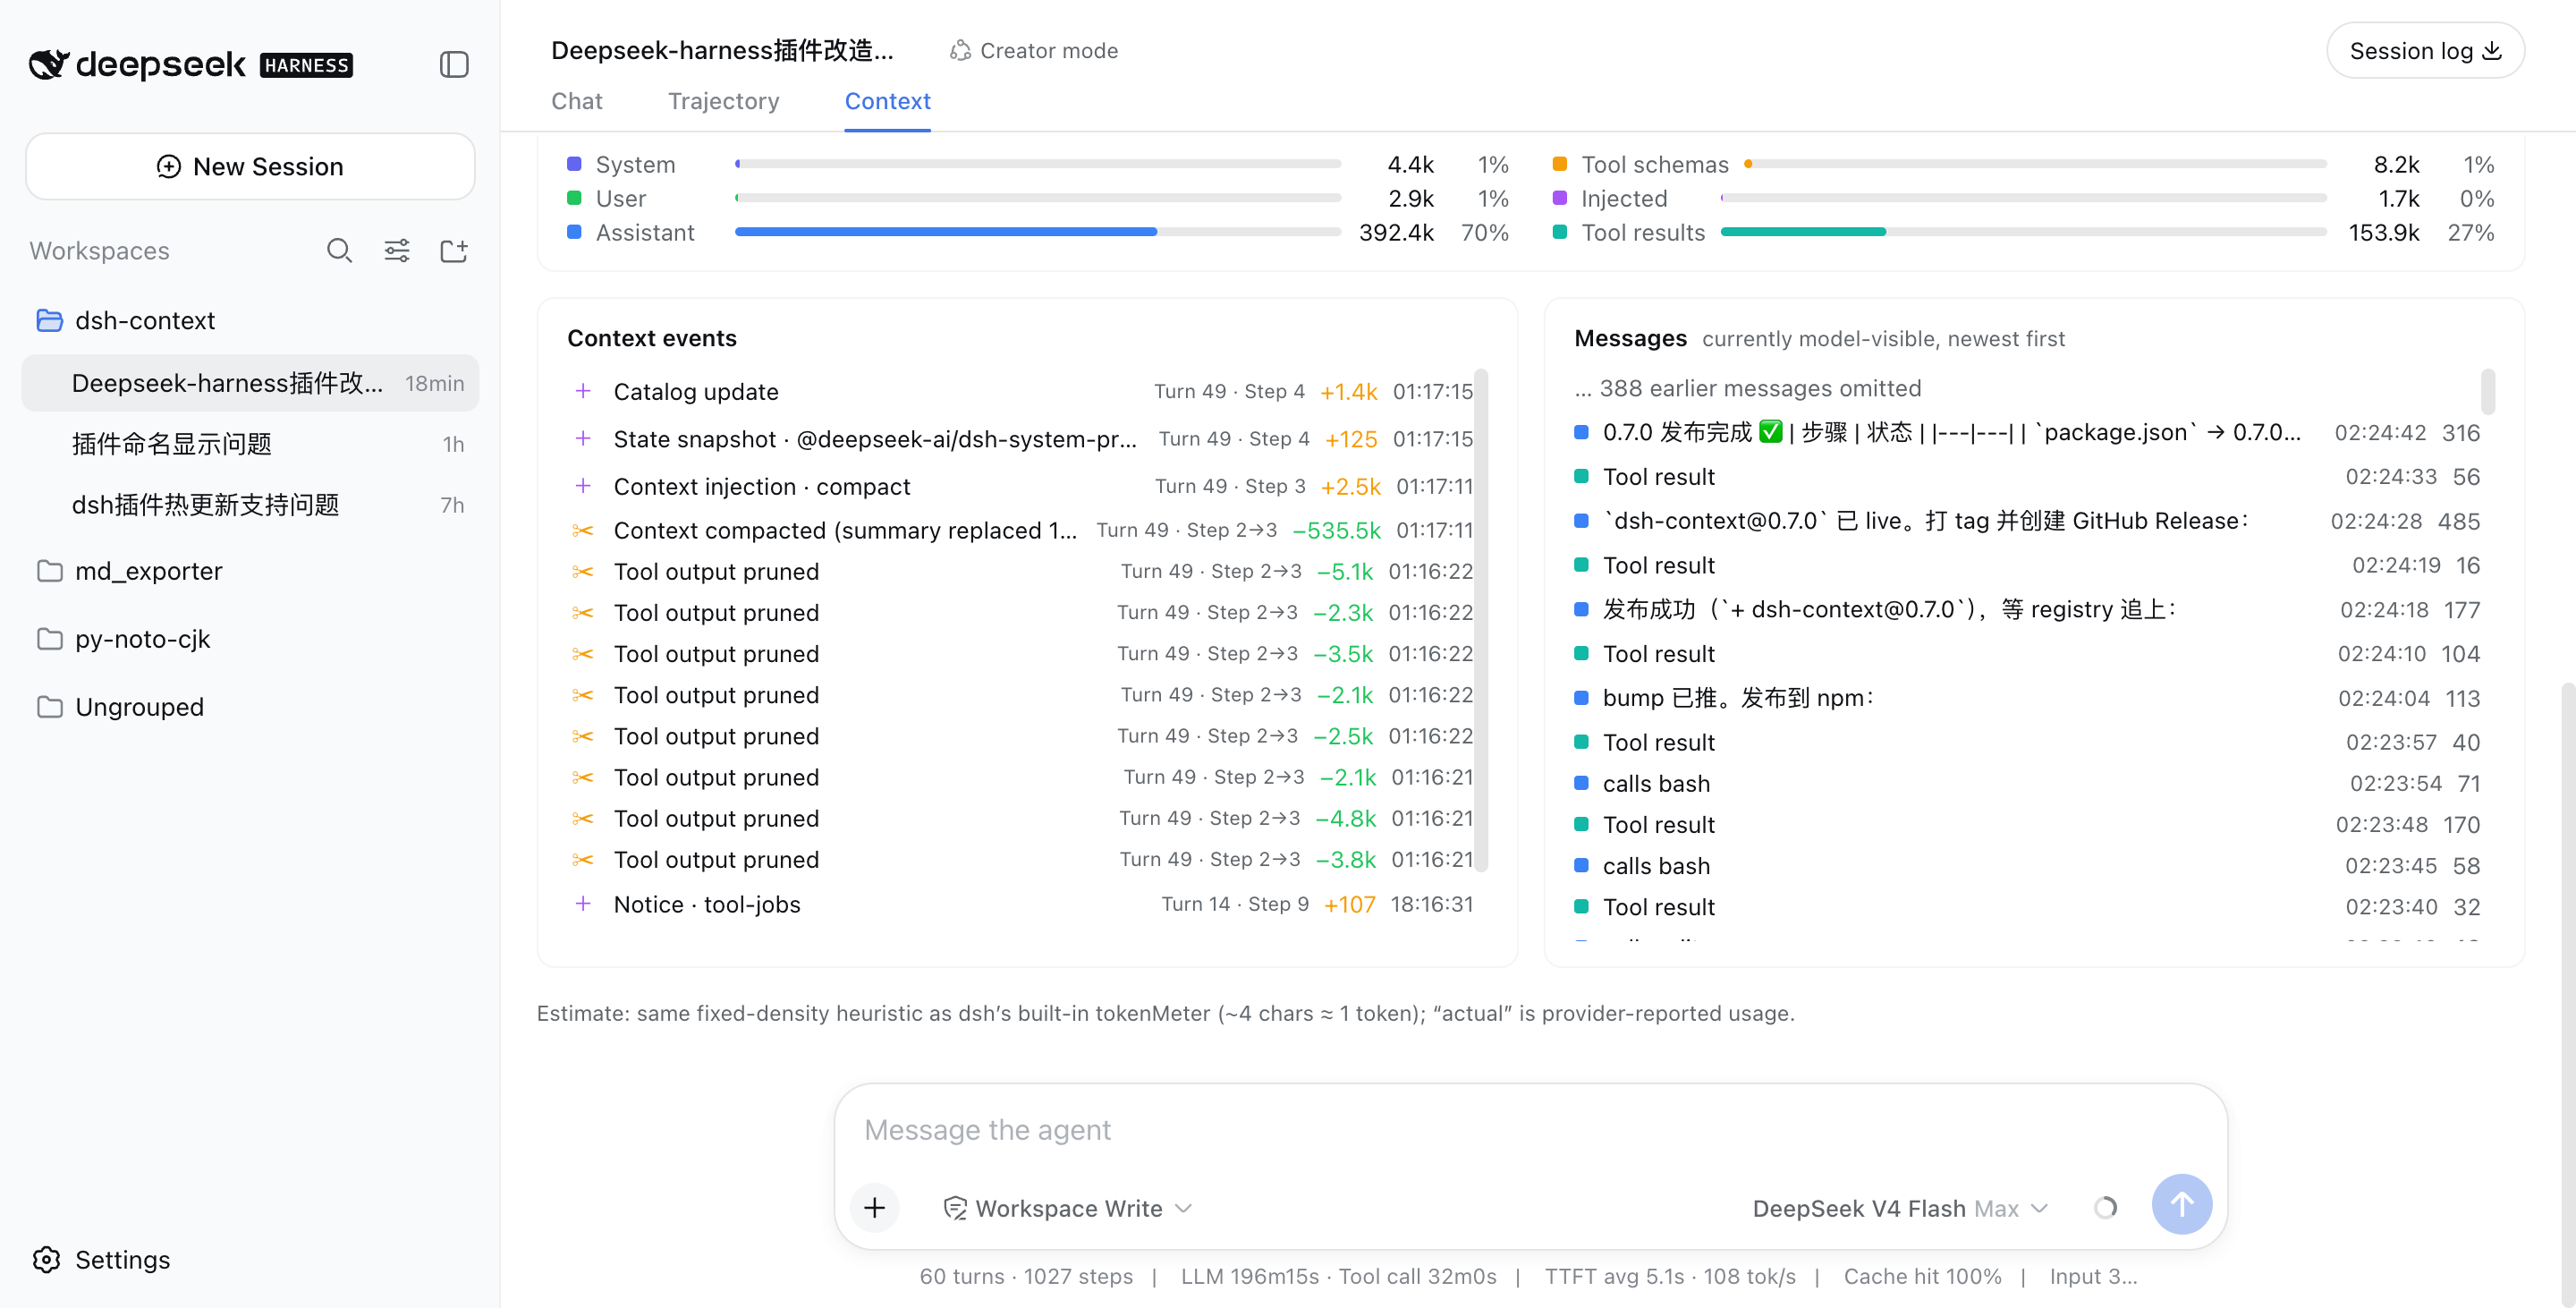
Every injection, compaction, prune, model switch, and plan-mode toggle — labeled with its producer (instruction file, plugin id, skill name), its net token delta (compactions show what they reclaimed), turn/step, and time. The Inject / Compact / Prune / Switch / Mode chips filter the log by kind, each carrying its whole-session event tally.
📁 File Activity — what the agent did to your files
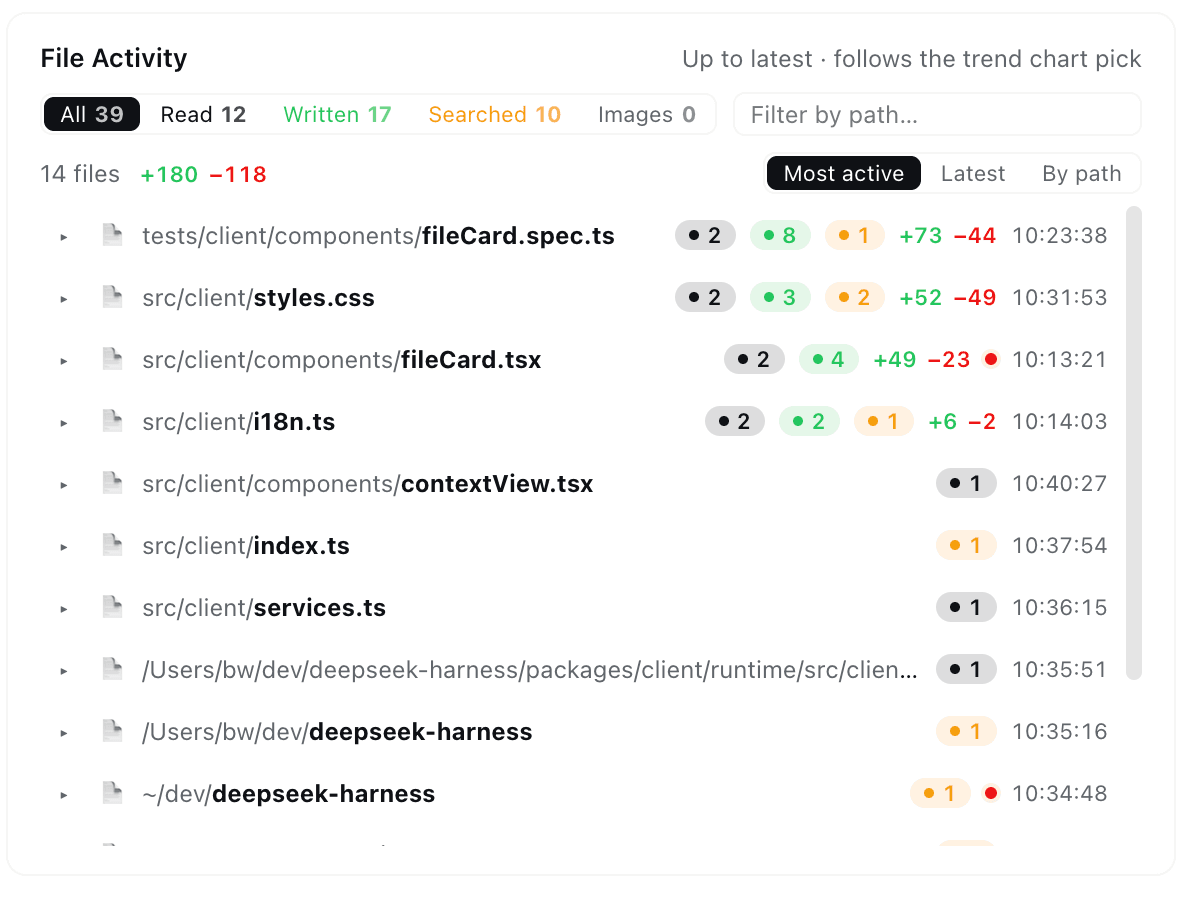
One row per touched file — read, written, or searched — aggregated up to whichever step you pick on the trend chart:
- Per-purpose counts with header chips doubling as filters (Read / Written / Searched / Images) and a path search box.
- Line deltas — every
edit/writecontributes its estimated+added / −removedfootprint, per file and summed. - Every mode counts — native tools, the Minimal preset’s
str_replace_editor, and the nested calls inside PTCrun_codeprograms are all folded into per-tool rows. - Searches land on real files — matched files get their own ops rows with hit counts.
- Click a row to expand its full operation log — every op jumps straight to the exact tool result in the Context browser.
- Click a file name to open its preview in the right Sidebar, exactly as the built-in Files sidebar does — the same viewer, the same tab-per-file behavior. On a harness without that column the name opens on your system as before.
🚢 The Fleet tab
Open any session and click the Fleet / 编队 tab (right of Context) — the agent family on a page of its own, with room for the collaboration surfaces that follow:
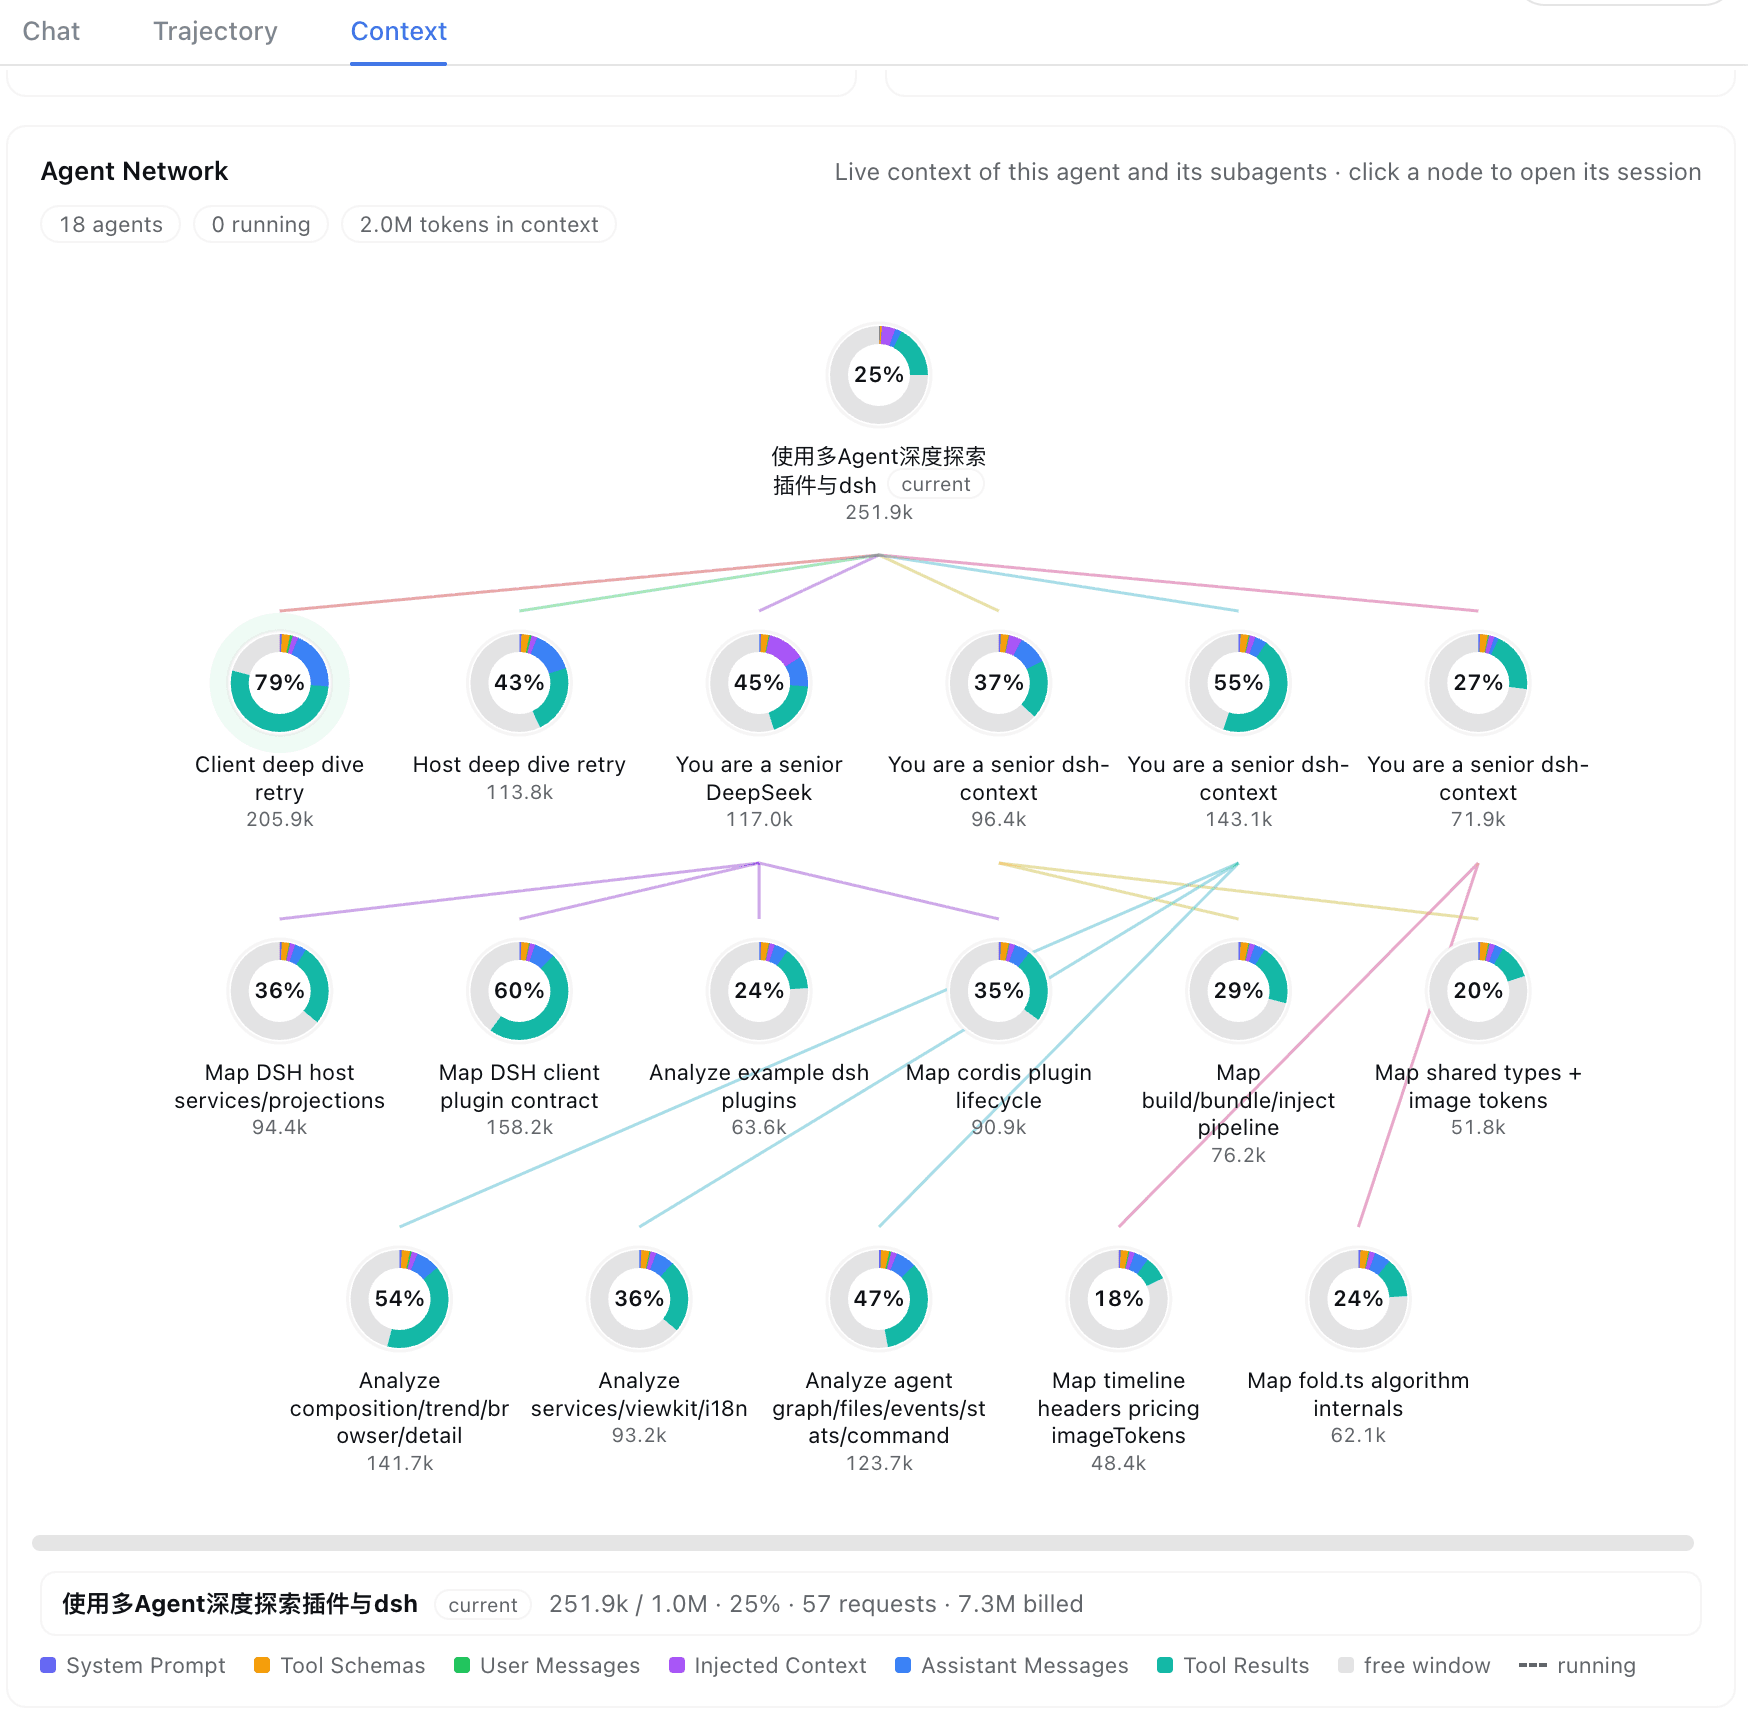
🕸 Agent Network — the family portrait
The current agent, its parents, and every subagent — one card per agent: its title, live context size and window occupancy, a composition bar, and how long it has run for and how many steps it has taken. Edges fan out from each parent in the lineage’s color — hover a card to light its whole chain and read the full breakdown in the detail strip; click to jump into that session’s own Context tab. Running agents breathe with a green pulse on their incoming edge and turn over the harness’s own rolling spinner beside their title, which settles into the same green dot the header’s subagent list uses once the work is done; narrow panes fold the family into tidy rows — never a horizontal scrollbar.
The right Sidebar’s Context panel keeps the same card inline, so the family stays one click away while you read the chat. Don’t want the tab at all? Turn Fleet tab off in the preferences card — the card then lives on in that panel, and the Context tab’s family cell opens it there whenever a Sidebar is served.
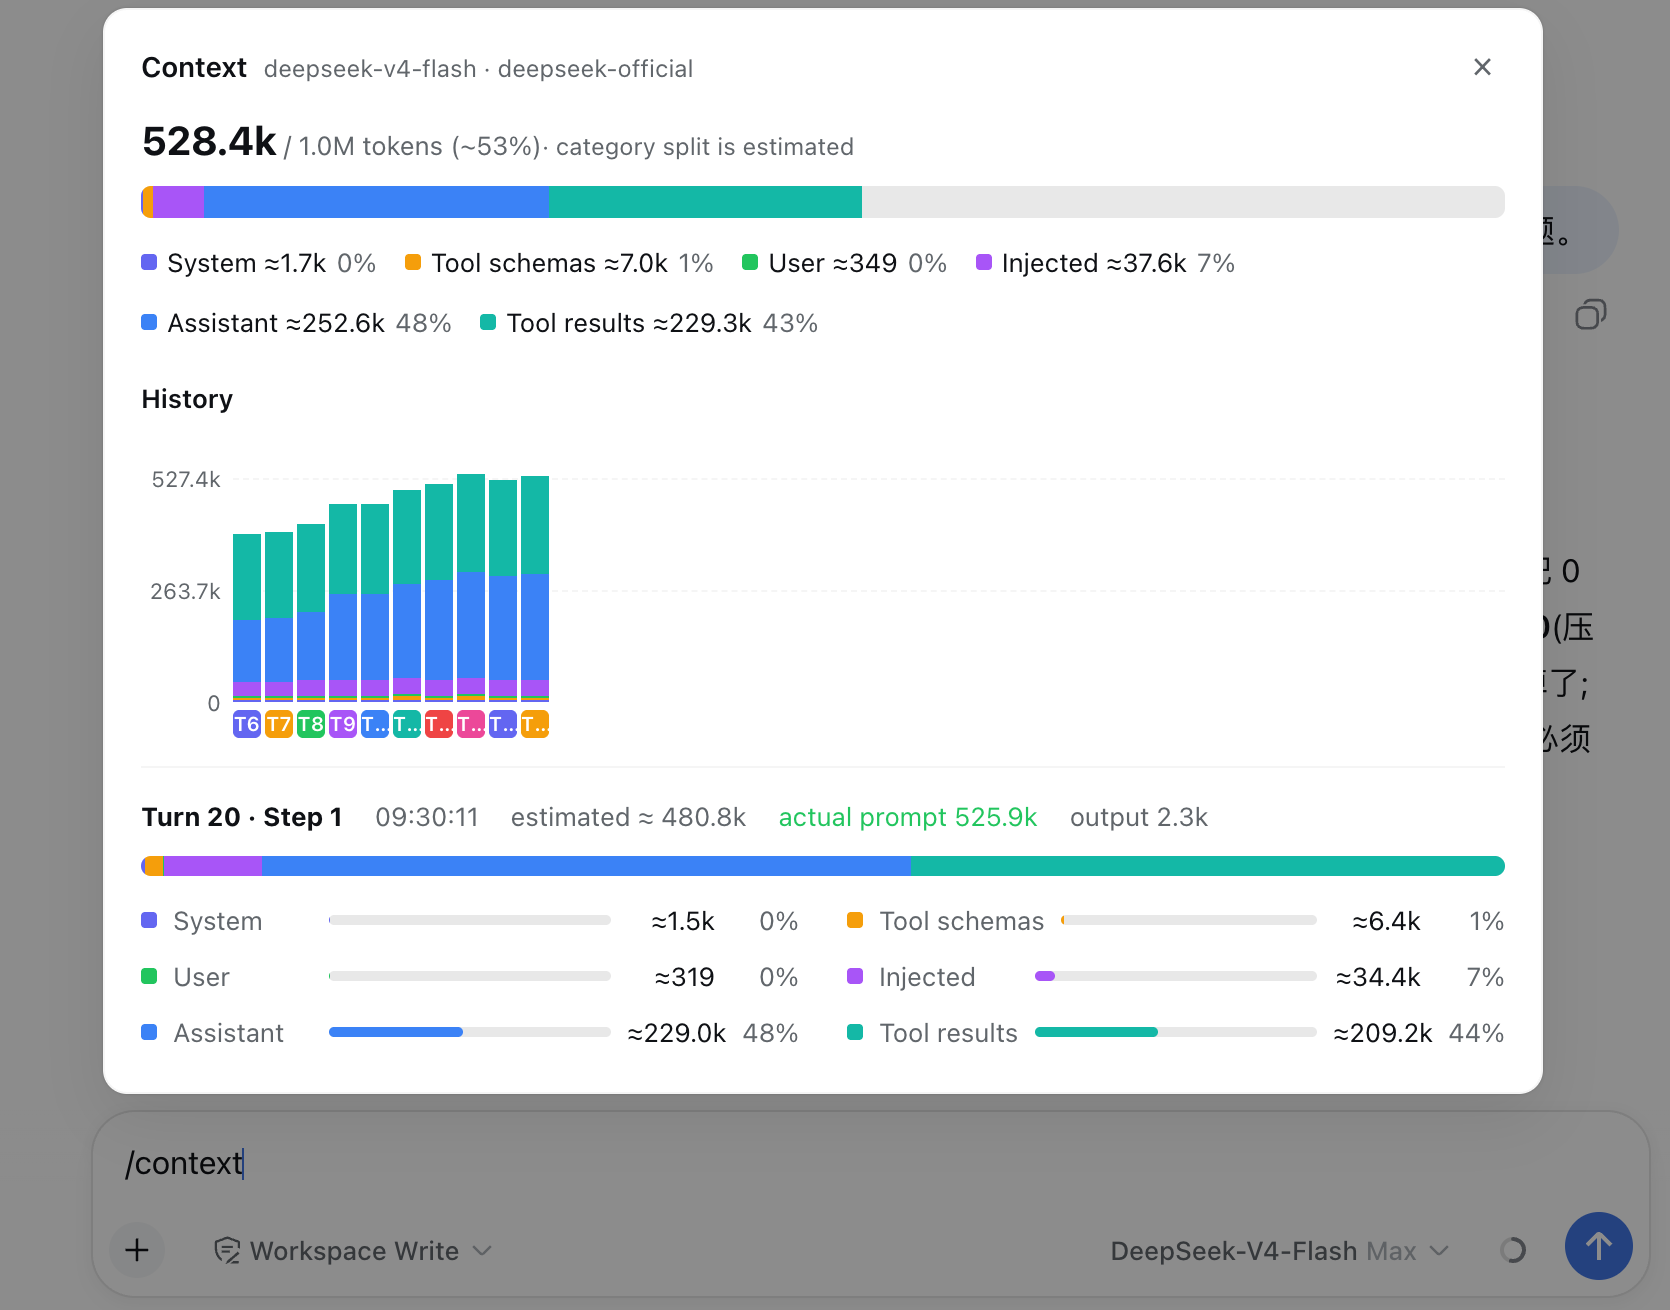
⌨️ /context command
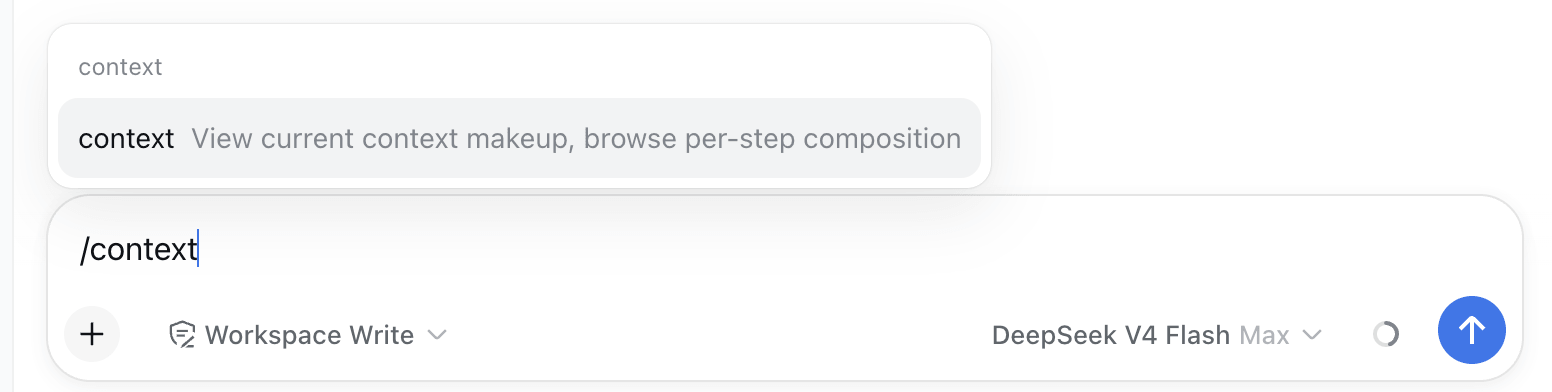
Type /context (or pick it from the / menu) and press Enter:
A centered dialog opens with the Current Composition card and the Context browser — the same composition bar, per-step picker, and vs previous turn diff badges as the tab:
⚙️ Settings
The Context preferences card holds this plugin’s per-user settings — default placement (the Context and Fleet conversation tabs, the right Sidebar panel, or both), the Fleet tab’s own Show/Hide switch, the Context Insights default range (Today / Last 7 days / Last 30 days / All, Last 30 days unless changed; picking a preset on the page writes it back), trend granularity (Step/Turn), trend mode (Total/Delta), the trend duration curve (shown by default), tool and File Activity sort, and the sidebar insights entry. It lives on the Plugins page: the sidebar Plugins entry → the dsh-context bundle’s page → its Configuration section (the card is served by the entry’s live Config form).
The System Prompt · Prefix / Suffix rows hold free text joined at the very start / end of every session’s system prompt, for all agents (subagents included) — a per-deployment persona or behavioral rule that rides the harness’s own prompt assembly. Edits apply from the next turn; leave a row empty to disable it.
The Context Insights preset buttons write the pick back as the stored default; every other in-chart and in-card toggle stays per-view and never overwrites the stored preference.
Good to know
- Estimates vs actuals — category figures use dsh’s own fixed-density heuristic (the same one as its built-in token meter); the pinned trend details show provider-reported actuals next to them, and the Token card pairs its ≈-estimated composition shares with the provider-exact billed total.
- Compatibility — works on
@deepseek-ai/dsh0.1.7-rc.2+ (the0.1.7line from rc.2 and the0.2.0line from rc.2), the V4 session-log generation, from one shape-driven code path. The per-release matrix and how it is verified: docs/compatibility.md. - I18n — UI in English and 简体中文.
Like it?
If dsh-context helped you understand what your agent is carrying around, a ⭐ on GitHub is much appreciated — and issues/PRs are welcome!
License
相似文章
@hiwise_aigc: 最近重度使用 DSH 桌面端,发现大鲸鱼好不好用,不光看模型,插件也能直接改变体验! 如果你也在用 DSH,下面这 7 个插件,我真心建议装上。用顺手了,才知道什么叫生产力拉满。 我的 DSH 必装插件清单: billion-contex…
一篇社交媒体经验帖,作者推荐 DSH 桌面端的 7 款必装插件,包括 billion-context(上下文压缩)、dshmarket(插件市场)、dsh-codex-ui、dsh-better-sidebar、dsh-git-graph、dsh-free-search 和 dsh-ops,覆盖界面、搜索、Git 与终端等使用场景,并鼓励读者在评论区补充推荐。
@I_am_oil_oil: 我自己在用的一些 DeepSeek 插件推荐: 1. https://github.com/dataelement/dsh-desktop… 将 DeepSeek Harness 包装为桌面端 2. https://github.com/…
本文推荐了一些用于 DeepSeek 的插件,包括将 DeepSeek Harness 包装为桌面端的 DSH Desktop,以及其他实用工具。
@Saccc_c: L站网友还是太超模了,有人根据GitHub上泄漏的DeepSeek Harness 内测生态插件仓库,反推出了部分技术架构 供参考,只能说对DeepSeek Harness期待住了!
L站网友根据GitHub上泄漏的DeepSeek Harness内测生态插件仓库,反推出了部分技术架构,引发对DeepSeek Harness的期待。
@xiangxiang103: 变天了!DeepSeek 把插件市场的大门,拆了!!! 昨晚 DSH alpha.4 一个不起眼的更新:支持自定义插件索引源 翻译成人话: 以后 DSH 能装什么插件,不再只看官方,任何人都能开一家插件商店 更炸的是速度—— 官方发布不到…
DeepSeek Harness (DSH) alpha.4 支持自定义插件索引源,任何人可搭建自己的插件商店,社区已连夜将 Grok Bot 市场的 90 个 bot 迁移进 DeepSeek 生态,被称为 DSH 的“App Store 时刻”。
@BoxMrChen: Deepseek Harness理念很牛逼。 把所有东西都做成插件了,Gui,Tui,并且反对把 plan、subagent、权限、MCP 等工作流固化进核心 我说实话第一眼我就感觉,他们重新发明了Pi Agent 虽然是用Cordis作…
作者评论 Deepseek Harness 的插件化理念,认为其将 GUI/TUI 等全部插件化、反对固化工作流,并对比 Pi Agent、Prime-Agent,提出在 REPL 中构建可自进化的 Agent 构想,已用 Codex 开始实现。