An in-depth exploration of the Fourier transform, starting from Fourier series and extending to non-periodic functions, with interactive visualizations and mathematical derivation.
<link rel="stylesheet" href="https://eli.thegreenplace.net/demos/fourier/windowed.css"><p>The Fourier series is a great tool for analyzing periodic functions. But
what about functions that don’t repeat? <a class="reference external" href="https://eli.thegreenplace.net/2026/notes-on-fourier-series/">We’ve
seen</a>
that we can compute Fourier series for a non-periodic function defined
on a finite interval, as long as we don’t care about its behavior beyond
that interval.</p>
<p>Let’s extend this idea to functions that <em>never</em> repeat; that is,
non-periodic functions defined on the interval <object class="valign-m4 latex-math" data="https://eli.thegreenplace.net/images/math/1cf8fee97b88d4aa5eb4787c05b533d0db945e98.svg" style="height: 18px;" type="image/svg+xml">(-\infty,\infty)</object>.</p>
<div class="section" id="visualizing-fourier-series-for-non-repeating-functions">
<h2>Visualizing Fourier series for non-repeating functions</h2>
<p>To motivate the subject ahead, let’s look back at the example used in
the earlier <a class="reference external" href="https://eli.thegreenplace.net/2026/notes-on-fourier-series/">post about Fourier
series</a>:</p>
<object class="align-center" data="https://eli.thegreenplace.net/images/math/219270dd9765adc74c363412ff71219137e90f0c.svg" style="height: 51px;" type="image/svg+xml">\[t(x)=
\begin{cases}
x & 0 \leq x \leq 1 \\
2-x & 1 < x \leq 2 \\
\end{cases}\]</object>
<p>With an odd extension into <object class="valign-m4 latex-math" data="https://eli.thegreenplace.net/images/math/8291e9956dc145c0d40503664cdb2aa8907faeec.svg" style="height: 17px;" type="image/svg+xml">[-2,0]</object>. In that post, to make the
Fourier series work, we assumed <object class="valign-m4 latex-math" data="https://eli.thegreenplace.net/images/math/75a7147566fd4ba98fe5d85fe008fab6d58d3968.svg" style="height: 17px;" type="image/svg+xml">t(x)</object> keeps repeating with a
period <object class="valign-0 latex-math" data="https://eli.thegreenplace.net/images/math/8f459dda90739295986eb4ce950ace772ec696f7.svg" style="height: 12px;" type="image/svg+xml">2L=4</object> on the entire <object class="valign-0 latex-math" data="https://eli.thegreenplace.net/images/math/11f6ad8ec52a2984abaafd7c3b516503785c2072.svg" style="height: 8px;" type="image/svg+xml">x</object> axis. Here, let’s face the
reality that it does not - in fact - repeat, and observe how our Fourier
series work out.</p>
<p>Recall that the Fourier series approximating <object class="valign-m4 latex-math" data="https://eli.thegreenplace.net/images/math/75a7147566fd4ba98fe5d85fe008fab6d58d3968.svg" style="height: 17px;" type="image/svg+xml">t(x)</object> are the sine
series (since it’s an odd function):</p>
<object class="align-center" data="https://eli.thegreenplace.net/images/math/7942a20004aaf07d850b012826c56720f6efa3ce.svg" style="height: 41px;" type="image/svg+xml">\[t(x)=\frac{8}{\pi^2}\bigg[ sin\frac{\pi x}{2}-\frac{1}{3^2} sin\frac{3\pi x}{2}+\frac{1}{5^2}sin\frac{5\pi x}{2}-\cdots\bigg]\]</object>
<p>The following visualization is interactive. By default, it shows
<object class="valign-m4 latex-math" data="https://eli.thegreenplace.net/images/math/75a7147566fd4ba98fe5d85fe008fab6d58d3968.svg" style="height: 17px;" type="image/svg+xml">t(x)</object> (with its odd extension) and no Fourier series
approximation. We’ll proceed by a series of steps and observe the
outcome:</p>
<div class="plot-stack">
<canvas id="series-canvas" class="canvas" width="760" height="470"></canvas>
<div class="controls">
<div class="number-controls">
<div class="number-control">
<label for="terms-number">n (terms in the Fourier series)</label>
<input id="terms-number" type="number" min="0" max="500" step="1" value="0">
</div>
<div class="number-control">
<label for="interval-l">L</label>
<input id="interval-l" type="number" min="2" max="128" step="1" value="2">
</div>
<div class="number-control">
<label for="x-min">x min</label>
<input id="x-min" type="number" min="-512" max="511" step="1" value="-16">
</div>
<div class="number-control">
<label for="x-max">x max</label>
<input id="x-max" type="number" min="-511" max="512" step="1" value="16">
</div>
</div>
</div>
<canvas id="coeffs-canvas" class="canvas" width="760" height="260"></canvas>
</div><p><strong>Step 1</strong>: set <img alt="n" class="valign-0 latex-math" src="https://eli.thegreenplace.net/images/math/d1854cae891ec7b29161ccaf79a24b00c274bdaa.png" style="height: 7px;" /> to some non-zero number; already at 3, the
approximation is very good.</p>
<p>The frequency spacing is <object class="valign-m6 latex-math" data="https://eli.thegreenplace.net/images/math/5a600bbe993cfd18233241243dff681270daa29f.svg" style="height: 19px;" type="image/svg+xml">\frac{\pi}{L}</object> (this is the coefficient
of <object class="valign-0 latex-math" data="https://eli.thegreenplace.net/images/math/11f6ad8ec52a2984abaafd7c3b516503785c2072.svg" style="height: 8px;" type="image/svg+xml">x</object> in the sines). Note that the Fourier series repeats every
<object class="valign-0 latex-math" data="https://eli.thegreenplace.net/images/math/8dde33545500de38fae974b4b18036def142e9e3.svg" style="height: 12px;" type="image/svg+xml">2L</object>, as expected.</p>
<p><strong>Step 2</strong>: increase <object class="valign-0 latex-math" data="https://eli.thegreenplace.net/images/math/d160e0986aca4714714a16f29ec605af90be704d.svg" style="height: 12px;" type="image/svg+xml">L</object> to 6. This means our series are
constructed assuming <object class="valign-m4 latex-math" data="https://eli.thegreenplace.net/images/math/75a7147566fd4ba98fe5d85fe008fab6d58d3968.svg" style="height: 17px;" type="image/svg+xml">t(x)</object> has a period of 12, not 4. Note how
the Fourier series look now - they repeat every 12, and they don’t match
<object class="valign-m4 latex-math" data="https://eli.thegreenplace.net/images/math/75a7147566fd4ba98fe5d85fe008fab6d58d3968.svg" style="height: 17px;" type="image/svg+xml">t(x)</object> as well as before. We can increase <img alt="n" class="valign-0 latex-math" src="https://eli.thegreenplace.net/images/math/d1854cae891ec7b29161ccaf79a24b00c274bdaa.png" style="height: 7px;" /> to a higher
number to make the match better. As <object class="valign-0 latex-math" data="https://eli.thegreenplace.net/images/math/d160e0986aca4714714a16f29ec605af90be704d.svg" style="height: 12px;" type="image/svg+xml">L</object> grows, the spacing between
adjacent frequencies decreases.</p>
<p><strong>Step 3</strong>: increase <object class="valign-0 latex-math" data="https://eli.thegreenplace.net/images/math/d160e0986aca4714714a16f29ec605af90be704d.svg" style="height: 12px;" type="image/svg+xml">L</object> to 10. We no longer see the repetitions,
so feel free to increase the values of <em>x min</em> and <em>x max</em> until you do.
Note again that we need to add more and more coefficients to match
<object class="valign-m4 latex-math" data="https://eli.thegreenplace.net/images/math/75a7147566fd4ba98fe5d85fe008fab6d58d3968.svg" style="height: 17px;" type="image/svg+xml">t(x)</object> better with this larger <object class="valign-0 latex-math" data="https://eli.thegreenplace.net/images/math/d160e0986aca4714714a16f29ec605af90be704d.svg" style="height: 12px;" type="image/svg+xml">L</object>, and the spacing adjacent
frequencies grows smaller.</p>
<p>Increasing <object class="valign-0 latex-math" data="https://eli.thegreenplace.net/images/math/d160e0986aca4714714a16f29ec605af90be704d.svg" style="height: 12px;" type="image/svg+xml">L</object> means our function repeats at larger and larger
intervals. The logical conclusion of this progression is to ask - what
happens if the function <em>never</em> repeats, meaning
<object class="valign-0 latex-math" data="https://eli.thegreenplace.net/images/math/7024b94c8e1c4e174500651fed6f4034b91338e2.svg" style="height: 12px;" type="image/svg+xml">L\rightarrow\infty</object>? While not mathematically rigorous, the
visual experiment here lets us make some conjectures: we’ll likely need
an infinite number of coefficients for a good approximation, and
moreover, the spacing between these coefficients will tend to zero.</p>
<p>In other words, instead of a discrete set of coefficients, we’ll end up
with a continuous line, or <em>function</em>. The function produced by this
process is the Fourier transform of <object class="valign-m4 latex-math" data="https://eli.thegreenplace.net/images/math/75a7147566fd4ba98fe5d85fe008fab6d58d3968.svg" style="height: 17px;" type="image/svg+xml">t(x)</object>, and the next section
shows its mathematical derivation.</p>
</div>
<div class="section" id="fourier-series-with-l-rightarrow-infty-leading-to-fourier-transform">
<h2>Fourier series with <object class="valign-0 latex-math heading-math" data="https://eli.thegreenplace.net/images/math/7024b94c8e1c4e174500651fed6f4034b91338e2.svg" style="height: 18px;" type="image/svg+xml">L\rightarrow\infty</object> leading to Fourier transform</h2>
<p>In these notes, we’ll be using the complex exponential formulation of
Fourier series:</p>
<object class="align-center" data="https://eli.thegreenplace.net/images/math/0330fae433a3379cfef316d192bfe32e38e0c9c9.svg" style="height: 47px;" type="image/svg+xml">\[f(x)=\sum_{n=-\infty}^{\infty}C_n\cdot e^{in\pi x/L}\]</object>
<p>With:</p>
<object class="align-center" data="https://eli.thegreenplace.net/images/math/d70fa4e75b4b604398d8d3c108a75bea622e72ef.svg" style="height: 43px;" type="image/svg+xml">\[C_n=\frac{1}{2L}\int_{-L}^{L}f(x)e^{-in\pi x/L}dx\]</object>
<p>We’re interested in a non-periodic <img alt="f(x)" class="valign-m4 latex-math" src="https://eli.thegreenplace.net/images/math/3e03f4706048fbc6c5a252a85d066adf107fcc1f.png" style="height: 17px;" /> defined on the interval
<object class="valign-m4 latex-math" data="https://eli.thegreenplace.net/images/math/1cf8fee97b88d4aa5eb4787c05b533d0db945e98.svg" style="height: 18px;" type="image/svg+xml">(-\infty,\infty)</object>. So we’ll be exploring the above equations for
<object class="valign-0 latex-math" data="https://eli.thegreenplace.net/images/math/7024b94c8e1c4e174500651fed6f4034b91338e2.svg" style="height: 12px;" type="image/svg+xml">L\rightarrow\infty</object>.</p>
<p>First, let’s make a slight change of notation. Instead of writing
formulae in terms of the period (<object class="valign-0 latex-math" data="https://eli.thegreenplace.net/images/math/8dde33545500de38fae974b4b18036def142e9e3.svg" style="height: 12px;" type="image/svg+xml">2L</object>), we’ll be using the n-th
harmonic angular frequency <object class="valign-m3 latex-math" data="https://eli.thegreenplace.net/images/math/a155ec23f6c406ec631eab262deac5c2207fc6f0.svg" style="height: 10px;" type="image/svg+xml">w_n</object>:</p>
<object class="align-center" data="https://eli.thegreenplace.net/images/math/a8298e8efef6e84054c4b533455925ee5428587e.svg" style="height: 32px;" type="image/svg+xml">\[w_n=\frac{n\pi}{L}\]</object>
<p>So we can slightly rewrite our series as:</p>
<object class="align-center" data="https://eli.thegreenplace.net/images/math/425809fafb73e6c3b365009d48f60e3c8b97c3f6.svg" style="height: 50px;" type="image/svg+xml">\[f(x)=\sum_{n=-\infty}^{\infty}C_n\cdot e^{i w_n x}=\sum_{n=-\infty}^{\infty}C_n\cdot e^{i\cdot n \Delta w x}\]</object>
<p>Using <object class="valign-0 latex-math" data="https://eli.thegreenplace.net/images/math/485c352e1532df3fe1ad52c8ac1ec6cdcefae85f.svg" style="height: 12px;" type="image/svg+xml">\Delta w</object> as the difference between two consecutive
frequencies:</p>
<object class="align-center" data="https://eli.thegreenplace.net/images/math/4a4e5e3ca5b4efb65f808b54881624aab7e7786d.svg" style="height: 38px;" type="image/svg+xml">\[\Delta w=w_n-w_{n-1}=\frac{n\pi}{L}-\frac{(n-1)\pi}{L}=\frac{\pi}{L}\]</object>
<p>Using this notation, <object class="valign-m3 latex-math" data="https://eli.thegreenplace.net/images/math/e6456786af3c999a8eda7658e37f7bf5d1bb0db0.svg" style="height: 14px;" type="image/svg+xml">C_n</object> is expressed as:</p>
<object class="align-center" data="https://eli.thegreenplace.net/images/math/0afc21dea01d897ed8870f1614de19df218852df.svg" style="height: 49px;" type="image/svg+xml">\[C_n=\frac{\Delta w}{2\pi}\int_{-\pi/\Delta w}^{\pi/\Delta w}f(x)e^{-i\cdot n \Delta w x}dx\]</object>
<p>So far there are no new insights here, just some new notation. Now we’re
going to use it to facilitate the next step.</p>
<p>Since <object class="valign-0 latex-math" data="https://eli.thegreenplace.net/images/math/2655eaa60b6a8bca030a08db9d96cdf601c2313f.svg" style="height: 12px;" type="image/svg+xml">L\rightarrow \infty</object>, then <object class="valign-0 latex-math" data="https://eli.thegreenplace.net/images/math/96155e6778d2196553d71682f0d84e6dae76c5bf.svg" style="height: 12px;" type="image/svg+xml">\Delta w\rightarrow 0</object>.
Let’s calculate the limit of the Fourier series representation of
<img alt="f(x)" class="valign-m4 latex-math" src="https://eli.thegreenplace.net/images/math/3e03f4706048fbc6c5a252a85d066adf107fcc1f.png" style="height: 17px;" /> when <object class="valign-0 latex-math" data="https://eli.thegreenplace.net/images/math/96155e6778d2196553d71682f0d84e6dae76c5bf.svg" style="height: 12px;" type="image/svg+xml">\Delta w\rightarrow 0</object>:</p>
<object class="align-center" data="https://eli.thegreenplace.net/images/math/3dd92646779c57175e26c408f74a5bc4685a082a.svg" style="height: 50px;" type="image/svg+xml">\[f(x)=\lim_{\Delta w\rightarrow 0}\sum_{n=-\infty}^{\infty}C_n\cdot e^{i\cdot n \Delta w x}\]</object>
<p>And substitute the latest <object class="valign-m3 latex-math" data="https://eli.thegreenplace.net/images/math/e6456786af3c999a8eda7658e37f7bf5d1bb0db0.svg" style="height: 14px;" type="image/svg+xml">C_n</object> into this equation, changing its
dummy integration variable from <object class="valign-0 latex-math" data="https://eli.thegreenplace.net/images/math/11f6ad8ec52a2984abaafd7c3b516503785c2072.svg" style="height: 8px;" type="image/svg+xml">x</object> to <object class="valign-0 latex-math" data="https://eli.thegreenplace.net/images/math/8efd86fb78a56a5145ed7739dcb00c78581c5375.svg" style="height: 11px;" type="image/svg+xml">t</object> to avoid
confusion <a class="footnote-reference" href="#footnote-1" id="footnote-reference-1">[1]</a></p>
<object class="align-center" data="https://eli.thegreenplace.net/images/math/36a8195b73e44ed8613e73e0d7021aa8eb6767fb.svg" style="height: 54px;" type="image/svg+xml">\[f(x)=\lim_{\Delta w\rightarrow 0}\sum_{n=-\infty}^{\infty}\left[\frac{\Delta w}{2\pi}\int_{-\pi/\Delta w}^{\pi/\Delta w}f(t)e^{-i\cdot n \Delta w t}dt\right]\cdot e^{i\cdot n \Delta w x}\]</object>
<p>Reordering slightly, and also replacing <object class="valign-0 latex-math" data="https://eli.thegreenplace.net/images/math/0c1caf138427d4c92d372c96fcff58fd614da6b0.svg" style="height: 12px;" type="image/svg+xml">n\Delta w</object> by <object class="valign-m3 latex-math" data="https://eli.thegreenplace.net/images/math/a155ec23f6c406ec631eab262deac5c2207fc6f0.svg" style="height: 10px;" type="image/svg+xml">w_n</object>
in the complex exponents:</p>
<object class="align-center" data="https://eli.thegreenplace.net/images/math/b30de7a7210644adeebf557aff3ab51cb7404071.svg" style="height: 54px;" type="image/svg+xml">\[f(x)=\frac{1}{2\pi}\lim_{\Delta w\rightarrow 0}\sum_{n=-\infty}^{\infty}\left[\int_{-\pi/\Delta w}^{\pi/\Delta w}f(t)e^{-i\cdot w_n t}dt\right]\cdot e^{i\cdot w_n x}\Delta w\]</object>
<p>Looking at the limit with the sum carefully, this is a Riemann sum (see
Appendix A)! <object class="valign-m3 latex-math" data="https://eli.thegreenplace.net/images/math/a155ec23f6c406ec631eab262deac5c2207fc6f0.svg" style="height: 10px;" type="image/svg+xml">w_n</object> is the "sampled" version of <img alt="w" class="valign-0 latex-math" src="https://eli.thegreenplace.net/images/math/aff024fe4ab0fece4091de044c58c9ae4233383a.png" style="height: 7px;" />, and
<object class="valign-0 latex-math" data="https://eli.thegreenplace.net/images/math/96155e6778d2196553d71682f0d84e6dae76c5bf.svg" style="height: 12px;" type="image/svg+xml">\Delta w\rightarrow 0</object>. We can therefore replace it by an
integral, changing <object class="valign-m3 latex-math" data="https://eli.thegreenplace.net/images/math/a155ec23f6c406ec631eab262deac5c2207fc6f0.svg" style="height: 10px;" type="image/svg+xml">w_n</object> to <img alt="w" class="valign-0 latex-math" src="https://eli.thegreenplace.net/images/math/aff024fe4ab0fece4091de044c58c9ae4233383a.png" style="height: 7px;" /> and <object class="valign-0 latex-math" data="https://eli.thegreenplace.net/images/math/485c352e1532df3fe1ad52c8ac1ec6cdcefae85f.svg" style="height: 12px;" type="image/svg+xml">\Delta w</object> to
<object class="valign-0 latex-math" data="https://eli.thegreenplace.net/images/math/e2c44c572970480e0089da2b6ef90adce84d30fd.svg" style="height: 12px;" type="image/svg+xml">dw</object> <a class="footnote-reference" href="#footnote-2" id="footnote-reference-2">[2]</a>:</p>
<object class="align-center" data="https://eli.thegreenplace.net/images/math/0d75ff66b6512adbf6049eae18dcd320e5908736.svg" style="height: 43px;" type="image/svg+xml">\[f(x)=\frac{1}{2\pi}\int_{-\infty}^{\infty}\left[\int_{-\infty}^{\infty}f(t)e^{-i\cdot wt}dt\right]\cdot e^{i\cdot w x}dw\]</object>
<p>The inner integral is called the <em>Fourier transform</em> of <img alt="f(x)" class="valign-m4 latex-math" src="https://eli.thegreenplace.net/images/math/3e03f4706048fbc6c5a252a85d066adf107fcc1f.png" style="height: 17px;" /> and
denoted <a class="footnote-reference" href="#footnote-3" id="footnote-reference-3">[3]</a>:</p>
<object class="align-center" data="https://eli.thegreenplace.net/images/math/07b9baf87b9916d224d769466df53dbf352d2a1b.svg" style="height: 52px;" type="image/svg+xml">\[\boxed{\hat{f}(w)=\mathcal{F}\left[f(x)\right]=\int_{-\infty}^{\infty}f(x)e^{-i\cdot wx}dx}\]</object>
<p>And the full equation for <img alt="f(x)" class="valign-m4 latex-math" src="https://eli.thegreenplace.net/images/math/3e03f4706048fbc6c5a252a85d066adf107fcc1f.png" style="height: 17px;" /> is then the <em>inverse</em> Fourier
transform:</p>
<object class="align-center" data="https://eli.thegreenplace.net/images/math/47a2a5bfdc5feed1ef59d8e8311c47539c409ce7.svg" style="height: 52px;" type="image/svg+xml">\[\boxed{f(x)=\mathcal{F}^{-1}\left[\hat{f}(w)\right]=\frac{1}{2\pi}\int_{-\infty}^{\infty}\hat{f}(w)e^{i\cdot w x}dw}\]</object>
</div>
<div class="section" id="example-calculation-of-fourier-transform">
<h2>Example calculation of Fourier transform</h2>
<p>Let’s take our favorite odd triangular pulse example and calculate its
Fourier transform. The function’s mathematical definition and plot are
shown earlier in this post. Note that we’re not extending this function
periodically - it’s zero beyond the range <object class="valign-m4 latex-math" data="https://eli.thegreenplace.net/images/math/e3408d8a911334402313d66a53871a1c3b55607b.svg" style="height: 18px;" type="image/svg+xml">[-2,2]</object>; this is
exactly why we need the Fourier transform here - as we’ve seen, Fourier
series won’t do because the function they reconstruct eventually starts
repeating.</p>
<p>We’re looking to find:</p>
<object class="align-center" data="https://eli.thegreenplace.net/images/math/5506bcc40980dfd48a97a2b91f74d4c50727287f.svg" style="height: 43px;" type="image/svg+xml">\[\hat{t}(w)=\int_{-\infty}^{\infty}t(x)e^{-iwx}dx\]</object>
<p>To calculate the integral, let’s decompose the complex exponent using
Euler’s formula:</p>
<object class="align-center" data="https://eli.thegreenplace.net/images/math/292ca30113586e23eea20039364286010326b698.svg" style="height: 43px;" type="image/svg+xml">\[\hat{t}(w)=\int_{-\infty}^{\infty}t(x)cos(wx)dx-i\int_{-\infty}^{\infty}t(x)sin(wx)dx\]</object>
<p>Since our <object class="valign-m4 latex-math" data="https://eli.thegreenplace.net/images/math/75a7147566fd4ba98fe5d85fe008fab6d58d3968.svg" style="height: 17px;" type="image/svg+xml">t(x)</object> is odd, the <a class="reference external" href="https://eli.thegreenplace.net/2025/notes-on-even-and-odd-functions/">first integral is
zero</a>.
Also <object class="valign-m4 latex-math" data="https://eli.thegreenplace.net/images/math/4a37025f97bbb1bd1112f679a4d4a835b0655d9a.svg" style="height: 18px;" type="image/svg+xml">t(x)sin(wx)</object> is even, so we can write:</p>
<object class="align-center" data="https://eli.thegreenplace.net/images/math/8f6ce1d110a97ebbeed69dd3d0c1d13005d61f29.svg" style="height: 42px;" type="image/svg+xml">\[\hat{t}(w)=-2i\int_{0}^{\infty}t(x)sin(wx)dx\]</object>
<p>We’ve already calculated a very similar integral in the <a class="reference external" href="https://eli.thegreenplace.net/2026/notes-on-fourier-series/">post on Fourier
series</a>,
so let’s just skip to the result:</p>
<object class="align-center" data="https://eli.thegreenplace.net/images/math/04fd51ed0652d76467822ab94caff1646ac72c72.svg" style="height: 38px;" type="image/svg+xml">\[\hat{t}(w)=-2i\cdot\frac{2\cdot sin(w)-sin(2w)}{w^2}\]</object>
<p>The only remaining difficulty is its value at 0, which seems undefined
at first (division by zero). However, note that as
<object class="valign-0 latex-math" data="https://eli.thegreenplace.net/images/math/29f6b518c7088d0c00dca4681f333cf8aa8dac2c.svg" style="height: 12px;" type="image/svg+xml">w\rightarrow 0</object>, the numerator also tends to 0, so we can use
L’Hopital’s rule (twice!) to find that:</p>
<object class="align-center" data="https://eli.thegreenplace.net/images/math/22b22759b568da532013a7b794fd45efc56bd45a.svg" style="height: 27px;" type="image/svg+xml">\[\lim_{w\rightarrow 0} \hat{t}(w)=0\]</object>
<p>Therefore:</p>
<object class="align-center" data="https://eli.thegreenplace.net/images/math/273a16b2d33abc3b6237a01b85c051fd8964c7aa.svg" style="height: 54px;" type="image/svg+xml">\[\hat{t}(w)=
\begin{cases}
-2i\cdot\frac{2\cdot sin(w)-sin(2w)}{w^2} & w\neq 0 \\
0 & w=0 \\
\end{cases}\]</object>
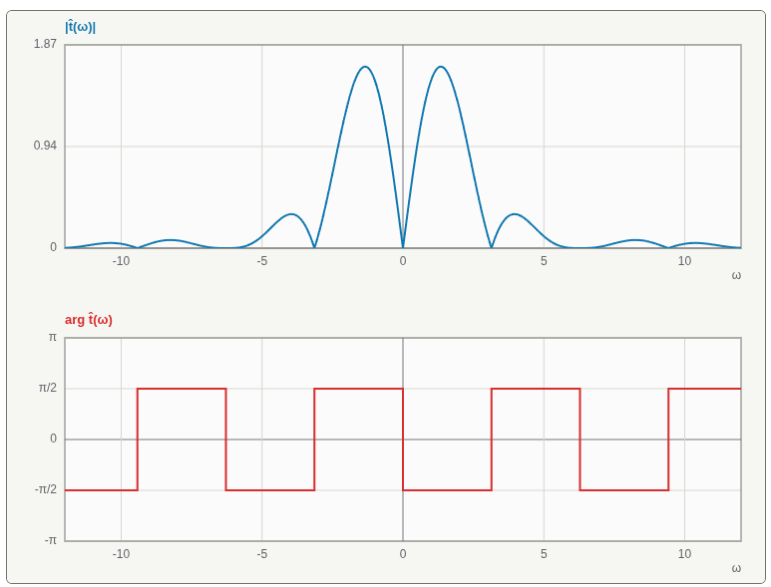
<p>This function is complex-valued; in fact, it’s purely imaginary. How do
we visualize it? A common way to visualize complex-valued functions is
by plotting their magnitude and phase separately.</p>
<p>The magnitude of <object class="valign-m4 latex-math" data="https://eli.thegreenplace.net/images/math/0e6e891eb70ed9e095f8516b2fc3f201c0bf9d8e.svg" style="height: 20px;" type="image/svg+xml">\hat{t}(w)</object> is:</p>
<object class="align-center" data="https://eli.thegreenplace.net/images/math/c77013c89e8bff5b08d1a65f7b4446b2b58be3c4.svg" style="height: 43px;" type="image/svg+xml">\[|\hat{t}(w)|=\sqrt{\hat{t}(w)\cdot\hat{t}(w)^*}=2\left|\frac{2\cdot sin(w)-sin(2w)}{w^2} \right|\]</object>
<p>Since <object class="valign-m4 latex-math" data="https://eli.thegreenplace.net/images/math/0e6e891eb70ed9e095f8516b2fc3f201c0bf9d8e.svg" style="height: 20px;" type="image/svg+xml">\hat{t}(w)</object> is purely imaginary, there are only two options
for the phase:</p>
<p>When the numerator is positive, we get a negative imaginary number with
phase <object class="valign-m4 latex-math" data="https://eli.thegreenplace.net/images/math/2adf81a4226f7a9a304fbb318c5cebf66d36767a.svg" style="height: 18px;" type="image/svg+xml">-\pi/2</object>, and when the numerator is negative, we get a
positive imaginary number with phase <object class="valign-m4 latex-math" data="https://eli.thegreenplace.net/images/math/9a0abc6cd5f06f21e0cde768dd87e46761225d7c.svg" style="height: 18px;" type="image/svg+xml">\pi/2</object>. Finally, when
<object class="valign-m4 latex-math" data="https://eli.thegreenplace.net/images/math/34f7cc2b88e04307f30fd5ec74afec4960849abb.svg" style="height: 20px;" type="image/svg+xml">\hat{t}(w)=0</object> (which happens at <object class="valign-0 latex-math" data="https://eli.thegreenplace.net/images/math/ed0fa1c268b0a22f58e3bbc08ee1bc0b03b10ce6.svg" style="height: 12px;" type="image/svg+xml">w=0</object>, by our earlier
analysis, but also whenever <img alt="w" class="valign-0 latex-math" src="https://eli.thegreenplace.net/images/math/aff024fe4ab0fece4091de044c58c9ae4233383a.png" style="height: 7px;" /> is a whole multiple of
<object class="valign-0 latex-math" data="https://eli.thegreenplace.net/images/math/6ac47b6d7372b4087583cfd048d20f4c1571f5cf.svg" style="height: 7px;" type="image/svg+xml">\pi</object>), the phase is undefined.</p>
<p>Here’s the magnitude and phase of <object class="valign-m4 latex-math" data="https://eli.thegreenplace.net/images/math/0e6e891eb70ed9e095f8516b2fc3f201c0bf9d8e.svg" style="height: 20px;" type="image/svg+xml">\hat{t}(w)</object> plotted against
<img alt="w" class="valign-0 latex-math" src="https://eli.thegreenplace.net/images/math/aff024fe4ab0fece4091de044c58c9ae4233383a.png" style="height: 7px;" />:</p>
<img alt="Magnitude and phase of the fourier transform of t(x)" class="align-center" src="https://eli.thegreenplace.net/images/2026/ft-triangle.png" />
<p>It is common to talk about <object class="valign-m4 latex-math" data="https://eli.thegreenplace.net/images/math/0e6e891eb70ed9e095f8516b2fc3f201c0bf9d8e.svg" style="height: 20px;" type="image/svg+xml">\hat{t}(w)</object> as the <em>frequency domain</em>
representation of <object class="valign-m4 latex-math" data="https://eli.thegreenplace.net/images/math/75a7147566fd4ba98fe5d85fe008fab6d58d3968.svg" style="height: 17px;" type="image/svg+xml">t(x)</object>.</p>
</div>
<div class="section" id="the-frequency-domain-representation-of-functions">
<h2>The frequency domain representation of functions</h2>
<p>When the functions we’re working with have <em>time</em> as their domain (e.g.
the <object class="valign-0 latex-math" data="https://eli.thegreenplace.net/images/math/11f6ad8ec52a2984abaafd7c3b516503785c2072.svg" style="height: 8px;" type="image/svg+xml">x</object> in <object class="valign-m4 latex-math" data="https://eli.thegreenplace.net/images/math/75a7147566fd4ba98fe5d85fe008fab6d58d3968.svg" style="height: 17px;" type="image/svg+xml">t(x)</object> represents time), which is often the case
in the study of signals and systems, the Fourier transform can be seen
as computing the <em>frequency domain</em> representation of the function.</p>
<p>Here’s the Fourier transform formula again:</p>
<object class="align-center" data="https://eli.thegreenplace.net/images/math/2205c7692318aadcd75f8fc3daf794dabccf4b1c.svg" style="height: 43px;" type="image/svg+xml">\[\hat{f}(w)=\mathcal{F}\left[f(x)\right]=\int_{-\infty}^{\infty}f(x)e^{-i\cdot wx}dx\]</object>
<p>It takes <img alt="f(x)" class="valign-m4 latex-math" src="https://eli.thegreenplace.net/images/math/3e03f4706048fbc6c5a252a85d066adf107fcc1f.png" style="height: 17px;" /> - the <em>time domain</em> representation of a function,
and converts it to <object class="valign-m4 latex-math" data="https://eli.thegreenplace.net/images/math/9bff3d85604c5a00197a2164be2410dac224875c.svg" style="height: 22px;" type="image/svg+xml">\hat{f}(w)</object> - a <em>frequency domain</em>
representation. For well-behaved functions, these two representations
are dual - each one describes the function completely, just in a
different way.</p>
<p>To convert back from a frequency domain representation to the time
domain, we use the inverse Fourier transform:</p>
<object class="align-center" data="https://eli.thegreenplace.net/images/math/2de25f35b6f53ae6a33c7113aaf818605e809eb5.svg" style="height: 43px;" type="image/svg+xml">\[\mathcal{F}^{-1}\left[\hat{f}(w)\right]=\frac{1}{2\pi}\int_{-\infty}^{\infty}\hat{f}(w)e^{i\cdot w x}dw\]</object>
<p>While a time-domain plot (<object class="valign-m4 latex-math" data="https://eli.thegreenplace.net/images/math/75a7147566fd4ba98fe5d85fe008fab6d58d3968.svg" style="height: 17px;" type="image/svg+xml">t(x)</object>) shows how a signal changes over
time, a frequency-domain plot (<object class="valign-m4 latex-math" data="https://eli.thegreenplace.net/images/math/0e6e891eb70ed9e095f8516b2fc3f201c0bf9d8e.svg" style="height: 20px;" type="image/svg+xml">\hat{t}(w)</object>) shows how the signal
is distributed across all possible frequencies. Moreover, as we’ve seen,
<object class="valign-m4 latex-math" data="https://eli.thegreenplace.net/images/math/0e6e891eb70ed9e095f8516b2fc3f201c0bf9d8e.svg" style="height: 20px;" type="image/svg+xml">\hat{t}(w)</object> is complex valued. Each frequency therefore has both
a magnitude and a phase: the magnitude tells us how strongly that
frequency contributes, while the phase tells us how that component is
shifted.</p>
<p>The frequency domain is extremely useful in signal analysis; for
example, when designing filters.</p>
<p>The Fourier transform also has a number of properties that are very
useful in signal analysis and processing. But first, let’s discuss what
a "well-behaved function" means for the purpose of applying Fourier
transforms.</p>
</div>
<div class="section" id="existence-condition-for-the-fourier-transform">
<h2>Existence condition for the Fourier transform</h2>
<p>The simplest existence condition for Fourier transforms is absolute
integrability (also known as Lebesgue integrable):</p>
<object class="align-center" data="https://eli.thegreenplace.net/images/math/a84f50b71f5f603ba8615fa9ce011a0bdf724c9f.svg" style="height: 43px;" type="image/svg+xml">\[\int_{-\infty}^{\infty}|f(x)|dx<\infty\]</object>
<p>With this condition, <object class="valign-m4 latex-math" data="https://eli.thegreenplace.net/images/math/9bff3d85604c5a00197a2164be2410dac224875c.svg" style="height: 22px;" type="image/svg+xml">\hat{f}(w)</object> exists on the entire <img alt="w" class="valign-0 latex-math" src="https://eli.thegreenplace.net/images/math/aff024fe4ab0fece4091de044c58c9ae4233383a.png" style="height: 7px;" />
domain, is continuous and vanishes (tends to 0) as
<object class="valign-m4 latex-math" data="https://eli.thegreenplace.net/images/math/ada7e71c306e8a50144d68218845379d20e80e2a.svg" style="height: 18px;" type="image/svg+xml">|w|\rightarrow\infty</object> <a class="footnote-reference" href="#footnote-4" id="footnote-reference-4">[4]</a>.</p>
<p>While this condition is sufficient, it’s not necessary; there are less
well-behaved functions that also have Fourier transforms defined with
some limitations. In these notes, we’re mostly interested in
well-behaved functions that are used in real-world engineering, so we
won’t discuss the other cases.</p>
<p>Another assumption commonly made for real-world functions is that they
vanish (tend to 0) as <object class="valign-m4 latex-math" data="https://eli.thegreenplace.net/images/math/82b120c729a8ff220a8f0fe52ac392486c01b204.svg" style="height: 18px;" type="image/svg+xml">|x|\rightarrow\infty</object>. While this is not a
direct outcome of absolute integrability <a class="footnote-reference" href="#footnote-5" id="footnote-reference-5">[5]</a>, it’s a reasonable
assumption in engineering. After all, real-world signals have finite
energies.</p>
<p>Intuitively, when we also assume <img alt="f(x)" class="valign-m4 latex-math" src="https://eli.thegreenplace.net/images/math/3e03f4706048fbc6c5a252a85d066adf107fcc1f.png" style="height: 17px;" /> is <a class="reference external" href="https://en.wikipedia.org/wiki/Uniform_continuity">uniformly
continuous</a>, the
assumption of vanishing at <object class="valign-m4 latex-math" data="https://eli.thegreenplace.net/images/math/82b120c729a8ff220a8f0fe52ac392486c01b204.svg" style="height: 18px;" type="image/svg+xml">|x|\rightarrow\infty</object> is a logical
conclusion, because otherwise how can the total area for <object class="valign-m4 latex-math" data="https://eli.thegreenplace.net/images/math/f81ff470d42c28556754b096c397ea462c3950b9.svg" style="height: 18px;" type="image/svg+xml">|f(x)|</object>
be finite?</p>
<p>An important outcome of this discussion is that the Fourier transform is
unsuitable for periodic functions. Functions that repeat at intervals
<em>are not absolute integrable</em>. For periodic functions, we use Fourier
series.</p>
</div>
<div class="section" id="some-useful-properties-of-fourier-transforms">
<h2>Some useful properties of Fourier transforms</h2>
<p><strong>Linearity</strong></p>
<p>The Fourier transform is a linear operator, because the integral is
linear:</p>
<object class="align-center" data="https://eli.thegreenplace.net/images/math/9a9c05c7059486e502bb8ef0ff3c868ac6597406.svg" style="height: 115px;" type="image/svg+xml">\[\begin{aligned}
\mathcal{F}\left[\alpha f(x)+\beta g(x)\right]&=\int_{-\infty}^{\infty}\alpha f(x)e^{-i\cdot wx}dx+\int_{-\infty}^{\infty}\beta g(x)e^{-i\cdot wx}dx\\
&=\alpha\int_{-\infty}^{\infty}f(x)e^{-i\cdot wx}dx+\beta\int_{-\infty}^{\infty}g(x)e^{-i\cdot wx}dx\\
&=\alpha\mathcal{F}\left[f(x)\right]+\beta\mathcal{F}\left[g(x)\right]
\end{aligned}\]</object>
<p>So is the inverse Fourier transform; it’s similarly easy to show that:</p>
<object class="align-center" data="https://eli.thegreenplace.net/images/math/ceb89864f3fa7c77f1a9e6ed8f63fa75aedd368a.svg" style="height: 32px;" type="image/svg+xml">\[\mathcal{F}^{-1}\left[\alpha\hat{f}(w)+\beta\hat{g}(w)\right]=
\alpha\mathcal{F}^{-1}\left[\hat{f}(w)\right]+\beta\mathcal{F}^{-1}\left[\hat{g}(w)\right]\]</object>
<p><strong>Scaling</strong></p>
<p>If we scale the domain of a function by a constant, its transform
changes only slightly:</p>
<object class="align-center" data="https://eli.thegreenplace.net/images/math/1c9ad54d80807d0cbeaa45001191bfc428550eca.svg" style="height: 43px;" type="image/svg+xml">\[\mathcal{F}\left[f(ax)\right]=\int_{-\infty}^{\infty}f(ax)e^{-i\cdot wx}dx\]</object>
<p>Let’s do the variable substitution <object class="valign-0 latex-math" data="https://eli.thegreenplace.net/images/math/6bc4494513070aed18d92705ed2b2f6d3f11c06e.svg" style="height: 8px;" type="image/svg+xml">u=ax</object>:</p>
<object class="align-center" data="https://eli.thegreenplace.net/images/math/afeab98c97af01549cebd9b6865d3eee363d7c54.svg" style="height: 43px;" type="image/svg+xml">\[\mathcal{F}\left[f(ax)\right]=\frac{1}{a}\int_{-\infty}^{\infty}f(u)e^{-i\cdot \frac{wu}{a}}du\]</object>
<p>This is the Fourier transform evaluated at <object class="valign-m6 latex-math" data="https://eli.thegreenplace.net/images/math/96bad6acb3e083e5c40a140be76e315fc38a0200.svg" style="height: 19px;" type="image/svg+xml">\frac{w}{a}</object>, so:</p>
<object class="align-center" data="https://eli.thegreenplace.net/images/math/9bd358bb9fbe2b08ec4aa6ed1967b52abc440b30.svg" style="height: 36px;" type="image/svg+xml">\[\mathcal{F}\left[f(ax)\right]=\frac{1}{a}\hat{f}\left(\frac{w}{a}\right)\]</object>
<p>There’s one small caveat here; when <object class="valign-0 latex-math" data="https://eli.thegreenplace.net/images/math/86f7e437faa5a7fce15d1ddcb9eaeaea377667b8.svg" style="height: 7px;" type="image/svg+xml">a</object> is negative, the integral
bounds should be flipped, causing a minus sign in front of the
transform. So we can write:</p>
<object class="align-center" data="https://eli.thegreenplace.net/images/math/b7e9ea4076f6b14c02d31e9efa69739dbc49e418.svg" style="height: 40px;" type="image/svg+xml">\[\mathcal{F}\left[f(ax)\right]=\frac{1}{|a|}\hat{f}\left(\frac{w}{a}\right)\]</object>
<p>Which works for any <object class="valign-m3 latex-math" data="https://eli.thegreenplace.net/images/math/bea889333f2129c15a3c4d1075622fe6d3af6091.svg" style="height: 16px;" type="image/svg+xml">a\ne 0</object>.</p>
<p>This property is intuitive when thinking about signals: suppose
<object class="valign-0 latex-math" data="https://eli.thegreenplace.net/images/math/496e056115bfe6ab294623525a9f7892000e8dcb.svg" style="height: 12px;" type="image/svg+xml">a>0</object>, then <object class="valign-m4 latex-math" data="https://eli.thegreenplace.net/images/math/80a7826fb0e21d406f279cfd05998f9ca6d7ddd9.svg" style="height: 18px;" type="image/svg+xml">f(ax)</object> means the signal is <em>compressed</em> in the
time domain by a factor <object class="valign-0 latex-math" data="https://eli.thegreenplace.net/images/math/86f7e437faa5a7fce15d1ddcb9eaeaea377667b8.svg" style="height: 7px;" type="image/svg+xml">a</object>. The scaling property says that the
frequency domain is <em>expanded</em> using the same factor; in other words,
the higher frequencies become more prominent because we need sharper
transitions to represent the compressed signal.</p>
<p><strong>Time shifting</strong></p>
<p>What happens to the Fourier transform if we time-shift the input signal
by some constant: <object class="valign-m4 latex-math" data="https://eli.thegreenplace.net/images/math/90aa755a71f6fd6a4007dad9bbc63a2c476cdaaf.svg" style="height: 18px;" type="image/svg+xml">f(x-x_0)</object>. By definition:</p>
<object class="align-center" data="https://eli.thegreenplace.net/images/math/9ca72dc1140fbec6eaeaf5addeb6d58647c46e9f.svg" style="height: 43px;" type="image/svg+xml">\[\mathcal{F}\left[f(x-x_0)\right]=\int_{-\infty}^{\infty}f(x-x_0)e^{-i\cdot wx}dx\]</object>
<p>Substituting <object class="valign-m3 latex-math" data="https://eli.thegreenplace.net/images/math/f0c6d185a731f9b08b4a02bc1360bbeec100f728.svg" style="height: 13px;" type="image/svg+xml">u=x-x_0</object>, we get <object class="valign-0 latex-math" data="https://eli.thegreenplace.net/images/math/febc1f31b2dbfc3e5d91801704e4d37f73c047af.svg" style="height: 12px;" type="image/svg+xml">du=dx</object>, so:</p>
<object class="align-center" data="https://eli.thegreenplace.net/images/math/cb6d354e88f41065c1ea89c6f5c1211f5c191b10.svg" style="height: 116px;" type="image/svg+xml">\[\begin{aligned}
\mathcal{F}\left[f(x-x_0)\right]&=\int_{-\infty}^{\infty}f(u)e^{-i\cdot w(u+x_0)}du\\
&=e^{-iwx_0}\int_{-\infty}^{\infty}f(u)e^{-i\cdot wu}du\\
&=e^{-iwx_0}\mathcal{F}\left[f(x)\right]
\end{aligned}\]</object>
<p><strong>Transform of a derivative</strong></p>
<p>An extremely useful property that’s often employed in the solution of
partial differential equations; let’s calculate the Fourier transform of
the derivative of <img alt="f(x)" class="valign-m4 latex-math" src="https://eli.thegreenplace.net/images/math/3e03f4706048fbc6c5a252a85d066adf107fcc1f.png" style="height: 17px;" />:</p>
<object class="align-center" data="https://eli.thegreenplace.net/images/math/c68df7988f98d39063d8653406b37eec649db284.svg" style="height: 43px;" type="image/svg+xml">\[\mathcal{F}\left[f'(x)\right]=\int_{-\infty}^{\infty}f'(x)e^{-i\cdot wx}dx\]</object>
<p>We’ll use integration by parts, where <object class="valign-m4 latex-math" data="https://eli.thegreenplace.net/images/math/9105027cd130b253982e71ba3781a3d2cab76497.svg" style="height: 18px;" type="image/svg+xml">dv=f'(x)</object> and
<object class="valign-0 latex-math" data="https://eli.thegreenplace.net/images/math/6c8c2392ded19fe4785df9e93e8f5a9afafb0b57.svg" style="height: 15px;" type="image/svg+xml">u=e^{-i\cdot wx}</object>. Therefore, <object class="valign-m4 latex-math" data="https://eli.thegreenplace.net/images/math/6e01683a36aeafb75c36f6f53287e0f3526e009d.svg" style="height: 18px;" type="image/svg+xml">v=f(x)</object> and
<object class="valign-m1 latex-math" data="https://eli.thegreenplace.net/images/math/a571d1529809275d168f3927dc0bf3596dcfd6bd.svg" style="height: 16px;" type="image/svg+xml">du=-iw\cdot e^{-i\cdot wx}</object>:</p>
<object class="align-center" data="https://eli.thegreenplace.net/images/math/404b14a4142a051740bd0295f55730fdad2cb914.svg" style="height: 43px;" type="image/svg+xml">\[\mathcal{F}\left[f'(x)\right]=\left[f(x)e^{-i\cdot wx}\right]^{\infty}_{-\infty}-\int_{-\infty}^{\infty}f(x)(-iw\cdot e^{-i\cdot wx})dx\]</object>
<p>Recall the assumption made in the "Existence condition..." section about
<img alt="f(x)" class="valign-m4 latex-math" src="https://eli.thegreenplace.net/images/math/3e03f4706048fbc6c5a252a85d066adf107fcc1f.png" style="height: 17px;" /> vanishing at infinities. So the first part of the equation
above is zero, and we’re left with:</p>
<object class="align-center" data="https://eli.thegreenplace.net/images/math/dc5d418235b7eba338e8e89f81294a0ea47e17b4.svg" style="height: 115px;" type="image/svg+xml">\[\begin{aligned}
\mathcal{F}\left[f'(x)\right]&=-\int_{-\infty}^{\infty}f(x)(-iw\cdot
e^{-i\cdot wx})dx\\
&=iw\int_{-\infty}^{\infty}f(x)e^{-i\cdot wx}dx\\
&=iw\cdot\mathcal{F}\left[f(x)\right]
\end{aligned}\]</object>
<p><strong>Transform of convolution</strong></p>
<p>The convolution between two continuous functions <img alt="f(x)" class="valign-m4 latex-math" src="https://eli.thegreenplace.net/images/math/3e03f4706048fbc6c5a252a85d066adf107fcc1f.png" style="height: 17px;" /> and
<object class="valign-m5 latex-math" data="https://eli.thegreenplace.net/images/math/65405422ff71ebf2db437dbd89a41355f4f19183.svg" style="height: 19px;" type="image/svg+xml">g(x)</object> is defined as:</p>
<object class="align-center" data="https://eli.thegreenplace.net/images/math/64d3b7f12adaf1aed1e65d923a25dc918750d92c.svg" style="height: 43px;" type="image/svg+xml">\[(f\ast g)(x)=\int_{-\infty}^{\infty}f(\xi)g(x-\xi)d\xi\]</object>
<p>Let’s calculate the Fourier transform of this function:</p>
<object class="align-center" data="https://eli.thegreenplace.net/images/math/a8f307d6edd7b1ac3fde4cda60dc344115e7800b.svg" style="height: 91px;" type="image/svg+xml">\[\begin{aligned}
\mathcal{F}\left[(f\ast g)(x)\right]&=\int_{-\infty}^{\infty}e^{-i\cdot wx}\left[\int_{-\infty}^{\infty}f(\xi)g(x-\xi)d\xi\right]dx\\
&=\int_{-\infty}^{\infty}\int_{-\infty}^{\infty}e^{-i\cdot wx}f(\xi)g(x-\xi)d\xi\ dx
\end{aligned}\]</object>
<p>This step of combining the integrals into a double integral, as well as
the next step (changing the order of integration) is possible due to
<a class="reference external" href="https://en.wikipedia.org/wiki/Fubini%27s_theorem">Fubini’s theorem</a>
and our assumption that <img alt="f(x)" class="valign-m4 latex-math" src="https://eli.thegreenplace.net/images/math/3e03f4706048fbc6c5a252a85d066adf107fcc1f.png" style="height: 17px;" /> and <object class="valign-m5 latex-math" data="https://eli.thegreenplace.net/images/math/65405422ff71ebf2db437dbd89a41355f4f19183.svg" style="height: 19px;" type="image/svg+xml">g(x)</object> are Lebesgue
integrable.</p>
<p>Switch order of integration:</p>
<object class="align-center" data="https://eli.thegreenplace.net/images/math/df9fde5e4b753f4c41e5c292f37db1068710b14e.svg" style="height: 43px;" type="image/svg+xml">\[\mathcal{F}\left[(f\ast g)(x)\right]=\int_{-\infty}^{\infty}\int_{-\infty}^{\infty}e^{-i\cdot wx}f(\xi)g(x-\xi)dx\ d\xi\]</object>
<p>Now, <object class="valign-m4 latex-math" data="https://eli.thegreenplace.net/images/math/2585072601e53de18cd0041cba511465ff8265d2.svg" style="height: 18px;" type="image/svg+xml">f(\xi)</object> in the inner integral doesn’t depend on <object class="valign-0 latex-math" data="https://eli.thegreenplace.net/images/math/11f6ad8ec52a2984abaafd7c3b516503785c2072.svg" style="height: 8px;" type="image/svg+xml">x</object>,
so we can pull it out:</p>
<object class="align-center" data="https://eli.thegreenplace.net/images/math/c59ef4659d72edb37cba1d180020f83dfc36d5a5.svg" style="height: 43px;" type="image/svg+xml">\[\mathcal{F}\left[(f\ast g)(x)\right]=\int_{-\infty}^{\infty}f(\xi)\int_{-\infty}^{\infty}e^{-i\cdot wx}g(x-\xi)dx\ d\xi\]</object>
<p>The inner integral is just the Fourier transform of a time-shifted
<object class="valign-m4 latex-math" data="https://eli.thegreenplace.net/images/math/58ff017207a2364bb206cc8fa1b5ee6ff77b4fd9.svg" style="height: 18px;" type="image/svg+xml">g(x-\xi)</object>, so we can write:</p>
<object class="align-center" data="https://eli.thegreenplace.net/images/math/088b586186d1a9dcb52289cf64705d389fff8cbf.svg" style="height: 43px;" type="image/svg+xml">\[\mathcal{F}\left[(f\ast g)(x)\right]=\int_{-\infty}^{\infty}f(\xi)e^{-i\cdot w\xi}\mathcal{F}\left[g(x)\right]d\xi=\mathcal{F}\left[g(x)\right]\int_{-\infty}^{\infty}e^{-i\cdot w\xi}f(\xi)d\xi\]</object>
<p>And the remaining integral is the Fourier transform of <img alt="f(x)" class="valign-m4 latex-math" src="https://eli.thegreenplace.net/images/math/3e03f4706048fbc6c5a252a85d066adf107fcc1f.png" style="height: 17px;" />, so:</p>
<object class="align-center" data="https://eli.thegreenplace.net/images/math/54626bd17186b72917424dd6c746874be19eb1c7.svg" style="height: 18px;" type="image/svg+xml">\[\mathcal{F}\left[(f\ast g)(x)\right]=\mathcal{F}\left[f\right]\cdot\mathcal{F}\left[g\right]\]</object>
<p>Convolution in the time domain translates to multiplication in the
frequency domain! This result is so important in signal processing that
it’s called <em>the convolution theorem</em>.</p>
</div>
<div class="section" id="appendix-a-riemann-sum-and-the-definite-integral">
<h2>Appendix A: Riemann sum and the definite integral</h2>
<p>Suppose we have some function <img alt="f(x)" class="valign-m4 latex-math" src="https://eli.thegreenplace.net/images/math/3e03f4706048fbc6c5a252a85d066adf107fcc1f.png" style="height: 17px;" /> and we want to know the area
bounded between this function’s graph and the <object class="valign-0 latex-math" data="https://eli.thegreenplace.net/images/math/11f6ad8ec52a2984abaafd7c3b516503785c2072.svg" style="height: 8px;" type="image/svg+xml">x</object> axis in a
certain interval <object class="valign-m4 latex-math" data="https://eli.thegreenplace.net/images/math/1475c39442659c6febe03b2e1809dbde6ec5fb5a.svg" style="height: 18px;" type="image/svg+xml">[a,b]</object>. One way to do this is to take a
<a class="reference external" href="https://en.wikipedia.org/wiki/Partition_of_an_interval">partition</a>
of the interval:</p>
<object class="align-center" data="https://eli.thegreenplace.net/images/math/11ef50ee14b24c3f7713698e491860e9fdd68d4a.svg" style="height: 16px;" type="image/svg+xml">\[a=x_0<x_1<\cdots<x_{n-1}<x_n=b\]</object>
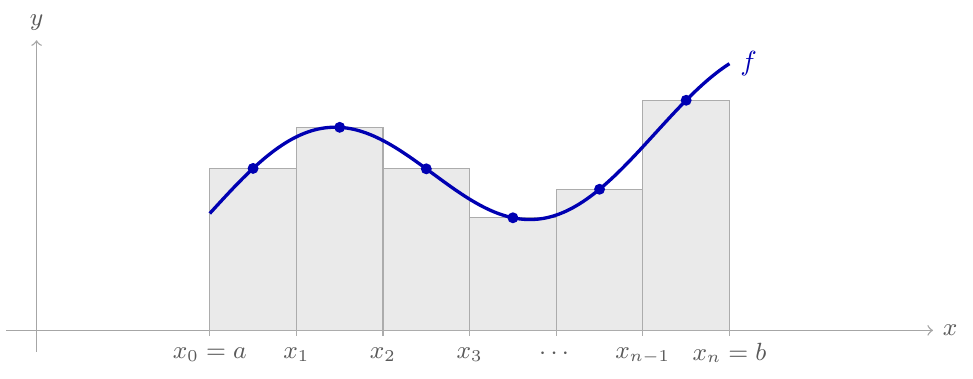
<p>And calculate the area under <img alt="f" class="valign-m3 latex-math" src="https://eli.thegreenplace.net/images/math/4a0a19218e082a343a1b17e5333409af9d98f0f5.png" style="height: 15px;" /> for every element of the
partition. We can then approximate such sub-areas by rectangles, as
follows:</p>
<img alt="Riemann sum plot" class="align-center" src="https://eli.thegreenplace.net/images/2026/riemann-sum.png" />
<p>We’ll denote the area of each rectangle as
<object class="valign-m5 latex-math" data="https://eli.thegreenplace.net/images/math/7795c99dae5b64c326a3108b4a697e32ce2263aa.svg" style="height: 18px;" type="image/svg+xml">f(x^*_i)\cdot\Delta x</object>:</p>
<ul class="simple">
<li><object class="valign-m4 latex-math" data="https://eli.thegreenplace.net/images/math/dc13de28bfc406ce5a194900ced006c8ada8fce9.svg" style="height: 18px;" type="image/svg+xml">\Delta x=(b-a)/n</object> is the width of one interval (assuming a
uniform partition, but the math works just as well for non-uniform
ones).</li>
<li><object class="valign-m5 latex-math" data="https://eli.thegreenplace.net/images/math/306d0e72ecd01369e781c973043a0c39fa258a8a.svg" style="height: 17px;" type="image/svg+xml">x^*_i</object> is some value in the interval <object class="valign-m4 latex-math" data="https://eli.thegreenplace.net/images/math/2408e92610b98a2ab3b45a54e2776cfad31c8e73.svg" style="height: 18px;" type="image/svg+xml">[x_{i-1},x_i]</object>.</li>
</ul>
<p>There are many ways to choose which point of the interval
<object class="valign-m4 latex-math" data="https://eli.thegreenplace.net/images/math/2408e92610b98a2ab3b45a54e2776cfad31c8e73.svg" style="height: 18px;" type="image/svg+xml">[x_{i-1},x_i]</object> to denote as <object class="valign-m5 latex-math" data="https://eli.thegreenplace.net/images/math/306d0e72ecd01369e781c973043a0c39fa258a8a.svg" style="height: 17px;" type="image/svg+xml">x^*_i</object>: left point
(<object class="valign-m4 latex-math" data="https://eli.thegreenplace.net/images/math/83baeffb5c41a6ad721e8c1a677f379b9dc8722c.svg" style="height: 12px;" type="image/svg+xml">x_{i-1}</object>), right point (<img alt="x_i" class="valign-m3 latex-math" src="https://eli.thegreenplace.net/images/math/34e03e6559b14df9fe5a97bbd2ed10109dfebbd3.png" style="height: 10px;" />), mid-point between the two
(which is what our plot shows) or anything in between. The distinction
doesn’t really matter for our purpose, as we will soon see.</p>
<p>We can approximate the area under the curve of <img alt="f" class="valign-m3 latex-math" src="https://eli.thegreenplace.net/images/math/4a0a19218e082a343a1b17e5333409af9d98f0f5.png" style="height: 15px;" /> in the interval
<object class="valign-m4 latex-math" data="https://eli.thegreenplace.net/images/math/1475c39442659c6febe03b2e1809dbde6ec5fb5a.svg" style="height: 18px;" type="image/svg+xml">[a,b]</object> with the <strong>Riemann sum</strong>, using a uniform partition:</p>
<object class="align-center" data="https://eli.thegreenplace.net/images/math/fb8aacc8d67e04353800371d56263c334fa42889.svg" style="height: 49px;" type="image/svg+xml">\[S=\sum_{i=1}^{n}f(x^*_i)\Delta x\]</object>
<p>If <img alt="f" class="valign-m3 latex-math" src="https://eli.thegreenplace.net/images/math/4a0a19218e082a343a1b17e5333409af9d98f0f5.png" style="height: 15px;" /> is continuous on <object class="valign-m4 latex-math" data="https://eli.thegreenplace.net/images/math/1475c39442659c6febe03b2e1809dbde6ec5fb5a.svg" style="height: 18px;" type="image/svg+xml">[a,b]</object>, then as
<object class="valign-0 latex-math" data="https://eli.thegreenplace.net/images/math/806d3bb52101b325f342d5a3b8ecfd32a067dc3b.svg" style="height: 8px;" type="image/svg+xml">n\rightarrow \infty</object>:</p>
<object class="align-center" data="https://eli.thegreenplace.net/images/math/81b22f1f683f913271c4cc8599761a3d95b24c70.svg" style="height: 50px;" type="image/svg+xml">\[S=\lim_{n\rightarrow \infty}\sum_{i=1}^{n}f(x^*_i)\Delta x=\int_{a}^{b}f(x)dx\]</object>
<p>This is known as the <strong>Riemann integral</strong>, or just the definite
integral. The limit is why the exact choice of <object class="valign-m5 latex-math" data="https://eli.thegreenplace.net/images/math/306d0e72ecd01369e781c973043a0c39fa258a8a.svg" style="height: 17px;" type="image/svg+xml">x^*_i</object> doesn’t
matter: as <object class="valign-0 latex-math" data="https://eli.thegreenplace.net/images/math/d700d1d5bd9381b68e71b723ba8f231ee62dd3f4.svg" style="height: 8px;" type="image/svg+xml">n\rightarrow\infty</object> we have
<object class="valign-0 latex-math" data="https://eli.thegreenplace.net/images/math/68c3d05c11aecce6ca6c6c45e1369f8e21440a47.svg" style="height: 12px;" type="image/svg+xml">\Delta x\rightarrow 0</object>, and all points within
<object class="valign-m4 latex-math" data="https://eli.thegreenplace.net/images/math/ee05ac539c5cac9ca6b187b374a09e20a3e587c9.svg" style="height: 18px;" type="image/svg+xml">[x_{i-1}, x_i]</object> are equally good.</p>
<hr class="docutils" />
<table class="docutils footnote" frame="void" id="footnote-1" rules="none">
<colgroup><col class="label" /><col /></colgroup>
<tbody valign="top">
<tr><td class="label"><a class="fn-backref" href="#footnote-reference-1">[1]</a></td><td>Note that <object class="valign-m3 latex-math" data="https://eli.thegreenplace.net/images/math/e6456786af3c999a8eda7658e37f7bf5d1bb0db0.svg" style="height: 14px;" type="image/svg+xml">C_n</object> is not a function of <object class="valign-0 latex-math" data="https://eli.thegreenplace.net/images/math/11f6ad8ec52a2984abaafd7c3b516503785c2072.svg" style="height: 8px;" type="image/svg+xml">x</object>; in its
definition, <object class="valign-0 latex-math" data="https://eli.thegreenplace.net/images/math/11f6ad8ec52a2984abaafd7c3b516503785c2072.svg" style="height: 8px;" type="image/svg+xml">x</object> only serves as a dummy integration variable and
can be called anything we choose. When we substitute <object class="valign-m3 latex-math" data="https://eli.thegreenplace.net/images/math/e6456786af3c999a8eda7658e37f7bf5d1bb0db0.svg" style="height: 14px;" type="image/svg+xml">C_n</object> into
the equation for <img alt="f(x)" class="valign-m4 latex-math" src="https://eli.thegreenplace.net/images/math/3e03f4706048fbc6c5a252a85d066adf107fcc1f.png" style="height: 17px;" />, which <em>is</em> a function of <object class="valign-0 latex-math" data="https://eli.thegreenplace.net/images/math/11f6ad8ec52a2984abaafd7c3b516503785c2072.svg" style="height: 8px;" type="image/svg+xml">x</object>, we
have to be careful. Thus the renaming.</td></tr>
</tbody>
</table>
<table class="docutils footnote" frame="void" id="footnote-2" rules="none">
<colgroup><col class="label" /><col /></colgroup>
<tbody valign="top">
<tr><td class="label"><a class="fn-backref" href="#footnote-reference-2">[2]</a></td><td>Note we apply the limit; therefore, the bounds of the inner integral
(in the square brackets) are now also between <object class="valign-m1 latex-math" data="https://eli.thegreenplace.net/images/math/18787d835dea1ca698e365c252f82b506cecfce7.svg" style="height: 12px;" type="image/svg+xml">-\infty</object> and
<object class="valign-0 latex-math" data="https://eli.thegreenplace.net/images/math/9b97f26fbeb1b84327c736de515f10980d9c7d68.svg" style="height: 8px;" type="image/svg+xml">\infty</object></td></tr>
</tbody>
</table>
<table class="docutils footnote" frame="void" id="footnote-3" rules="none">
<colgroup><col class="label" /><col /></colgroup>
<tbody valign="top">
<tr><td class="label"><a class="fn-backref" href="#footnote-reference-3">[3]</a></td><td>We change the dummy integration variable back to <object class="valign-0 latex-math" data="https://eli.thegreenplace.net/images/math/11f6ad8ec52a2984abaafd7c3b516503785c2072.svg" style="height: 8px;" type="image/svg+xml">x</object> here, for
consistency. Once again, since <object class="valign-0 latex-math" data="https://eli.thegreenplace.net/images/math/11f6ad8ec52a2984abaafd7c3b516503785c2072.svg" style="height: 8px;" type="image/svg+xml">x</object> is just the integration
variable and the integral is definite, the final result doesn’t
depend on <object class="valign-0 latex-math" data="https://eli.thegreenplace.net/images/math/11f6ad8ec52a2984abaafd7c3b516503785c2072.svg" style="height: 8px;" type="image/svg+xml">x</object>. It’s a function of <img alt="w" class="valign-0 latex-math" src="https://eli.thegreenplace.net/images/math/aff024fe4ab0fece4091de044c58c9ae4233383a.png" style="height: 7px;" />.</td></tr>
</tbody>
</table>
<table class="docutils footnote" frame="void" id="footnote-4" rules="none">
<colgroup><col class="label" /><col /></colgroup>
<tbody valign="top">
<tr><td class="label"><a class="fn-backref" href="#footnote-reference-4">[4]</a></td><td>The vanishing at infinity part is the Riemann-Lebesgue lemma; you can
find a proof on Wikipedia</td></tr>
</tbody>
</table>
<table class="docutils footnote" frame="void" id="footnote-5" rules="none">
<colgroup><col class="label" /><col /></colgroup>
<tbody valign="top">
<tr><td class="label"><a class="fn-backref" href="#footnote-reference-5">[5]</a></td><td>A pathological absolute-integrable function can have spikes at
infinity but still have a finite total area.</td></tr>
</tbody>
</table>
<script src="https://eli.thegreenplace.net/demos/fourier/windowed.js">
</script></div>
# Notes on the Fourier Transform
Source: [https://eli.thegreenplace.net/2026/notes-on-the-fourier-transform](https://eli.thegreenplace.net/2026/notes-on-the-fourier-transform)
The Fourier series is a great tool for analyzing periodic functions\. But what about functions that don’t repeat?[We’ve seen](https://eli.thegreenplace.net/2026/notes-on-fourier-series/)that we can compute Fourier series for a non\-periodic function defined on a finite interval, as long as we don’t care about its behavior beyond that interval\.
Let’s extend this idea to functions that*never*repeat; that is, non\-periodic functions defined on the interval \.
## Visualizing Fourier series for non\-repeating functions
To motivate the subject ahead, let’s look back at the example used in the earlier[post about Fourier series](https://eli.thegreenplace.net/2026/notes-on-fourier-series/):
With an odd extension into \. In that post, to make the Fourier series work, we assumed keeps repeating with a period on the entire axis\. Here, let’s face the reality that it does not \- in fact \- repeat, and observe how our Fourier series work out\.
Recall that the Fourier series approximating are the sine series \(since it’s an odd function\):
The following visualization is interactive\. By default, it shows \(with its odd extension\) and no Fourier series approximation\. We’ll proceed by a series of steps and observe the outcome:
n \(terms in the Fourier series\)
L
x min
x max
**Step 1**: setto some non\-zero number; already at 3, the approximation is very good\.
The frequency spacing is \(this is the coefficient of in the sines\)\. Note that the Fourier series repeats every , as expected\.
**Step 2**: increase to 6\. This means our series are constructed assuming has a period of 12, not 4\. Note how the Fourier series look now \- they repeat every 12, and they don’t match as well as before\. We can increaseto a higher number to make the match better\. As grows, the spacing between adjacent frequencies decreases\.
**Step 3**: increase to 10\. We no longer see the repetitions, so feel free to increase the values of*x min*and*x max*until you do\. Note again that we need to add more and more coefficients to match better with this larger , and the spacing adjacent frequencies grows smaller\.
Increasing means our function repeats at larger and larger intervals\. The logical conclusion of this progression is to ask \- what happens if the function*never*repeats, meaning ? While not mathematically rigorous, the visual experiment here lets us make some conjectures: we’ll likely need an infinite number of coefficients for a good approximation, and moreover, the spacing between these coefficients will tend to zero\.
In other words, instead of a discrete set of coefficients, we’ll end up with a continuous line, or*function*\. The function produced by this process is the Fourier transform of , and the next section shows its mathematical derivation\.
## Fourier series with leading to Fourier transform
In these notes, we’ll be using the complex exponential formulation of Fourier series:
With:
We’re interested in a non\-periodicdefined on the interval \. So we’ll be exploring the above equations for \.
First, let’s make a slight change of notation\. Instead of writing formulae in terms of the period \(\), we’ll be using the n\-th harmonic angular frequency :
So we can slightly rewrite our series as:
Using as the difference between two consecutive frequencies:
Using this notation, is expressed as:
So far there are no new insights here, just some new notation\. Now we’re going to use it to facilitate the next step\.
Since , then \. Let’s calculate the limit of the Fourier series representation ofwhen :
And substitute the latest into this equation, changing its dummy integration variable from to to avoid confusion[\[1\]](https://eli.thegreenplace.net/2026/notes-on-the-fourier-transform#footnote-1)
Reordering slightly, and also replacing by in the complex exponents:
Looking at the limit with the sum carefully, this is a Riemann sum \(see Appendix A\)\! is the "sampled" version of, and \. We can therefore replace it by an integral, changing toand to[\[2\]](https://eli.thegreenplace.net/2026/notes-on-the-fourier-transform#footnote-2):
The inner integral is called the*Fourier transform*ofand denoted[\[3\]](https://eli.thegreenplace.net/2026/notes-on-the-fourier-transform#footnote-3):
And the full equation foris then the*inverse*Fourier transform:
## Example calculation of Fourier transform
Let’s take our favorite odd triangular pulse example and calculate its Fourier transform\. The function’s mathematical definition and plot are shown earlier in this post\. Note that we’re not extending this function periodically \- it’s zero beyond the range ; this is exactly why we need the Fourier transform here \- as we’ve seen, Fourier series won’t do because the function they reconstruct eventually starts repeating\.
We’re looking to find:
To calculate the integral, let’s decompose the complex exponent using Euler’s formula:
Since our is odd, the[first integral is zero](https://eli.thegreenplace.net/2025/notes-on-even-and-odd-functions/)\. Also is even, so we can write:
We’ve already calculated a very similar integral in the[post on Fourier series](https://eli.thegreenplace.net/2026/notes-on-fourier-series/), so let’s just skip to the result:
The only remaining difficulty is its value at 0, which seems undefined at first \(division by zero\)\. However, note that as , the numerator also tends to 0, so we can use L’Hopital’s rule \(twice\!\) to find that:
Therefore:
This function is complex\-valued; in fact, it’s purely imaginary\. How do we visualize it? A common way to visualize complex\-valued functions is by plotting their magnitude and phase separately\.
The magnitude of is:
Since is purely imaginary, there are only two options for the phase:
When the numerator is positive, we get a negative imaginary number with phase , and when the numerator is negative, we get a positive imaginary number with phase \. Finally, when \(which happens at , by our earlier analysis, but also wheneveris a whole multiple of \), the phase is undefined\.
Here’s the magnitude and phase of plotted against:
It is common to talk about as the*frequency domain*representation of \.
## The frequency domain representation of functions
When the functions we’re working with have*time*as their domain \(e\.g\. the in represents time\), which is often the case in the study of signals and systems, the Fourier transform can be seen as computing the*frequency domain*representation of the function\.
Here’s the Fourier transform formula again:
It takes\- the*time domain*representation of a function, and converts it to \- a*frequency domain*representation\. For well\-behaved functions, these two representations are dual \- each one describes the function completely, just in a different way\.
To convert back from a frequency domain representation to the time domain, we use the inverse Fourier transform:
While a time\-domain plot \(\) shows how a signal changes over time, a frequency\-domain plot \(\) shows how the signal is distributed across all possible frequencies\. Moreover, as we’ve seen, is complex valued\. Each frequency therefore has both a magnitude and a phase: the magnitude tells us how strongly that frequency contributes, while the phase tells us how that component is shifted\.
The frequency domain is extremely useful in signal analysis; for example, when designing filters\.
The Fourier transform also has a number of properties that are very useful in signal analysis and processing\. But first, let’s discuss what a "well\-behaved function" means for the purpose of applying Fourier transforms\.
## Existence condition for the Fourier transform
The simplest existence condition for Fourier transforms is absolute integrability \(also known as Lebesgue integrable\):
With this condition, exists on the entiredomain, is continuous and vanishes \(tends to 0\) as[\[4\]](https://eli.thegreenplace.net/2026/notes-on-the-fourier-transform#footnote-4)\.
While this condition is sufficient, it’s not necessary; there are less well\-behaved functions that also have Fourier transforms defined with some limitations\. In these notes, we’re mostly interested in well\-behaved functions that are used in real\-world engineering, so we won’t discuss the other cases\.
Another assumption commonly made for real\-world functions is that they vanish \(tend to 0\) as \. While this is not a direct outcome of absolute integrability[\[5\]](https://eli.thegreenplace.net/2026/notes-on-the-fourier-transform#footnote-5), it’s a reasonable assumption in engineering\. After all, real\-world signals have finite energies\.
Intuitively, when we also assumeis[uniformly continuous](https://en.wikipedia.org/wiki/Uniform_continuity), the assumption of vanishing at is a logical conclusion, because otherwise how can the total area for be finite?
An important outcome of this discussion is that the Fourier transform is unsuitable for periodic functions\. Functions that repeat at intervals*are not absolute integrable*\. For periodic functions, we use Fourier series\.
## Some useful properties of Fourier transforms
**Linearity**
The Fourier transform is a linear operator, because the integral is linear:
So is the inverse Fourier transform; it’s similarly easy to show that:
**Scaling**
If we scale the domain of a function by a constant, its transform changes only slightly:
Let’s do the variable substitution :
This is the Fourier transform evaluated at , so:
There’s one small caveat here; when is negative, the integral bounds should be flipped, causing a minus sign in front of the transform\. So we can write:
Which works for any \.
This property is intuitive when thinking about signals: suppose , then means the signal is*compressed*in the time domain by a factor \. The scaling property says that the frequency domain is*expanded*using the same factor; in other words, the higher frequencies become more prominent because we need sharper transitions to represent the compressed signal\.
**Time shifting**
What happens to the Fourier transform if we time\-shift the input signal by some constant: \. By definition:
Substituting , we get , so:
**Transform of a derivative**
An extremely useful property that’s often employed in the solution of partial differential equations; let’s calculate the Fourier transform of the derivative of:
We’ll use integration by parts, where and \. Therefore, and :
Recall the assumption made in the "Existence condition\.\.\." section aboutvanishing at infinities\. So the first part of the equation above is zero, and we’re left with:
**Transform of convolution**
The convolution between two continuous functionsand is defined as:
Let’s calculate the Fourier transform of this function:
This step of combining the integrals into a double integral, as well as the next step \(changing the order of integration\) is possible due to[Fubini’s theorem](https://en.wikipedia.org/wiki/Fubini%27s_theorem)and our assumption thatand are Lebesgue integrable\.
Switch order of integration:
Now, in the inner integral doesn’t depend on , so we can pull it out:
The inner integral is just the Fourier transform of a time\-shifted , so we can write:
And the remaining integral is the Fourier transform of, so:
Convolution in the time domain translates to multiplication in the frequency domain\! This result is so important in signal processing that it’s called*the convolution theorem*\.
## Appendix A: Riemann sum and the definite integral
Suppose we have some functionand we want to know the area bounded between this function’s graph and the axis in a certain interval \. One way to do this is to take a[partition](https://en.wikipedia.org/wiki/Partition_of_an_interval)of the interval:
And calculate the area underfor every element of the partition\. We can then approximate such sub\-areas by rectangles, as follows:
We’ll denote the area of each rectangle as :
- is the width of one interval \(assuming a uniform partition, but the math works just as well for non\-uniform ones\)\.
- is some value in the interval \.
There are many ways to choose which point of the interval to denote as : left point \(\), right point \(\), mid\-point between the two \(which is what our plot shows\) or anything in between\. The distinction doesn’t really matter for our purpose, as we will soon see\.
We can approximate the area under the curve ofin the interval with the**Riemann sum**, using a uniform partition:
Ifis continuous on , then as :
This is known as the**Riemann integral**, or just the definite integral\. The limit is why the exact choice of doesn’t matter: as we have , and all points within are equally good\.
---
[\[1\]](https://eli.thegreenplace.net/2026/notes-on-the-fourier-transform#footnote-reference-1)Note that is not a function of ; in its definition, only serves as a dummy integration variable and can be called anything we choose\. When we substitute into the equation for, which*is*a function of , we have to be careful\. Thus the renaming\.[\[2\]](https://eli.thegreenplace.net/2026/notes-on-the-fourier-transform#footnote-reference-2)Note we apply the limit; therefore, the bounds of the inner integral \(in the square brackets\) are now also between and[\[3\]](https://eli.thegreenplace.net/2026/notes-on-the-fourier-transform#footnote-reference-3)We change the dummy integration variable back to here, for consistency\. Once again, since is just the integration variable and the integral is definite, the final result doesn’t depend on \. It’s a function of\.[\[4\]](https://eli.thegreenplace.net/2026/notes-on-the-fourier-transform#footnote-reference-4)The vanishing at infinity part is the Riemann\-Lebesgue lemma; you can find a proof on Wikipedia[\[5\]](https://eli.thegreenplace.net/2026/notes-on-the-fourier-transform#footnote-reference-5)A pathological absolute\-integrable function can have spikes at infinity but still have a finite total area\.
This article provides detailed notes on discrete-time Fourier series (DTFS) and discrete-time Fourier transform (DTFT), covering their theoretical foundations and examples for signal processing applications.
This article explains the Fourier transform of power-law functions, focusing on the interesting case of 1/f noise and the symmetry between time and frequency domains.
An introduction to an interactive website that explains the Discrete Fourier Transform and digital signal processing concepts using visualizations and animations.
This article provides a detailed mathematical derivation of the Cooley-Tukey Fast Fourier Transform algorithm, explaining how it reduces the complexity of the Discrete Fourier Transform.
A beginner-friendly walkthrough of the Fast Fourier Transform using R, explaining how to interpret the fft function output, amplitude, phase, and the Nyquist limit.